


You can be right about where the world is going and keep looking in the wrong place for your next trade.
You can understand a company’s business, believe in its future, and know every level on its chart. You can spend hours waiting for the entry to improve.
Meanwhile, an entire group of stocks you barely follow can be building the kind of trends you keep hoping your favorite stock will develop.
That’s a difficult problem to recognize because you’re doing the work. You’re reading, watching, drawing levels, and staying informed. From the inside, it feels like preparation.
But all that effort is happening inside a list you may never have questioned.
The decision about where to look comes before the decision about what to buy. And if familiarity keeps making that first decision for you, better entries can only solve part of the problem.
In The market matters more than the stock, I laid out the order I use to make sense of the market:
Market → sector → industry → stock → trade.
I want to spend more time in the middle of that process. Because between having a view on the market and drawing an entry on a chart, there’s a decision that deserves far more attention:
Which stocks have earned a place in front of you?
People like what they’re familiar with
Think about how a stock ends up on your screen.
Maybe you’ve traded it before. Maybe you use its products. Maybe someone you follow talks about it every day. Over time, you learn its behavior and develop an opinion about what it should be worth.
There’s value in knowing a company. The problem starts when that knowledge becomes a permanent claim on your attention.
A weak week gives you something to explain. A failed breakout becomes something to wait through. Strength somewhere else looks less interesting because you haven’t spent the same amount of time understanding it.
You keep asking when your stock will start working.
Eventually, that’s the only question you’re researching.
For a trader trying to participate in sustained moves, this creates an opportunity cost that never appears as a line item in the account. Time spent defending one idea is time you can’t spend investigating another.
And the more attached you become, the easier it is to turn a trade into a long-term investment thesis without ever making that decision explicitly.
The company may have a wonderful future. Your trade still has a particular timeframe, an entry price, and capital at risk.
I want my research to respect that difference.
There’s more behind a stock than a good story
We usually discuss stocks one at a time. Their earnings. Their management. Their charts.
But companies also operate in groups. Businesses in the same industry can share customers, input costs, financing conditions, regulation, and changes in demand. A development that matters to one can matter to several of its peers.
An individual chart can therefore be expressing something larger than an individual story.
This is why I want to know what the stock’s peers are doing. If several businesses facing similar conditions are strengthening together, I have another piece of evidence to investigate. If one stock is rising while its peers deteriorate, I want to understand what makes that company different.
There’s research behind taking the group seriously.
In their 1999 paper, Do Industries Explain Momentum?, Tobias Moskowitz and Mark Grinblatt studied 20 U.S. industry portfolios from July 1963 to July 1995. They found that industry momentum accounted for a substantial part of the individual-stock momentum in their sample. Prior group performance contained information that looking at a stock in isolation could miss.
The study tested historical portfolios and specific holding periods. Applying a sector ranking to a discretionary trade is a different exercise, and the authors left profitability after actual trading costs open for further research.
My takeaway is direct: industry strength has been associated with stronger subsequent returns, and I want that tendency working for my trades. Choosing the right group can make a substantial difference to the move an individual stock delivers.
A good stock in a great sector can outperform a great stock in an average sector. The industry underneath makes that comparison more precise. Over the period I’m trading, a powerful wave of demand can matter more than how impressive a business looks on its own.
Think of it as catching a wave. Your stock has its own qualities, but the sector and industry can supply the force carrying it forward. When that force builds across a group, several stocks can advance together, and individual leaders can keep finding buyers as the move develops.
I want the wave behind my trade.
There are reasons this happens. Improving business conditions can lift expectations for several companies at once. A spending cycle can benefit suppliers across an industry. Better pricing or stronger demand can change the earnings outlook for a whole group. The individual stock is participating in a development larger than itself.
Institutional demand can reinforce that move. Imagine a portfolio manager deciding to increase exposure to an investment theme: energy supply, semiconductor spending, or infrastructure investment. That decision can produce buying across several related companies. Multiple managers expressing a similar view can create demand for the group, even though they choose different individual names.
Research on how stocks move together examines this category effect: investors group securities together and shift money into and out of those groups. That helps explain why understanding what investors want exposure to can matter alongside understanding an individual business.
ETFs provide another route. Investors can buy exposure to a sector or industry in one transaction. When strong demand pushes an ETF above the value of its holdings, market participants can buy the underlying basket and create ETF shares to sell. That process can transmit demand for the fund into demand for its stocks. The Investment Company Institute explains the mechanism here.
Many ETF trades simply exchange existing shares between investors. The connection to the underlying stocks comes through creation, arbitrage, and related trading. So I want evidence of actual flows before attributing a particular rally to ETF buying.
These forces can reinforce one another: improving business prospects attract investors, investors seek exposure to the group, and that demand helps lift individual stocks. That’s the wave I’m trying to participate in. It can also reverse, which is why I keep checking whether leadership and participation are holding up.
For me, sector → industry → stock is a way to pursue better trading results by putting several sources of strength behind the same idea. The entry and risk plan determine whether I can turn that opportunity into a profitable trade.
Start wide, then get specific
A sector gives you a broad area to investigate. An industry gives you a more specific set of businesses to compare.
Technology contains businesses with very different customers and economics. Software and semiconductors can experience very different conditions. Inside Energy, producers, refiners, and service companies don’t all benefit from the same developments in the same way.
Calling the whole sector strong or weak compresses those differences into one label.
That can be useful for orientation. It’s a poor place to finish the analysis.
I start by comparing sector performance over the same periods. Here, relative strength simply means performance compared with something else, such as the broad market or another sector. A group can be falling and still outperform a market that’s falling faster, so I also need to examine its own trend.
Then I look underneath the return. How many stocks are participating? Are several names maintaining constructive trends, or is a small number doing most of the work?
The distinction matters because an index weighted toward its largest companies can look healthier than many of its constituents. Participation helps me judge how widely the strength is shared.
From there, I compare industries within the sector. I want to find where the strength is concentrated, whether it has persisted beyond a brief bounce, and which individual stocks are contributing to it.
Each step makes the next question more specific.
“What’s happening in Technology?” becomes “Which parts of Technology are holding up?” That becomes “Which companies in those industries are leading, and which have a usable setup?”
That’s a much more focused research session than opening the same ten tickers and hoping one looks better today.
A good story still has to face the comparison
The Energy-versus-Technology comparison that prompted this article is a useful example.
In our saved market snapshot, from the June 30 close through September 8, 2026, the Energy sector ETF, XLE, gained 21.95%. The Information Technology sector ETF, XLK, lost 1.39%. Those are price returns over the same interval, excluding dividends.
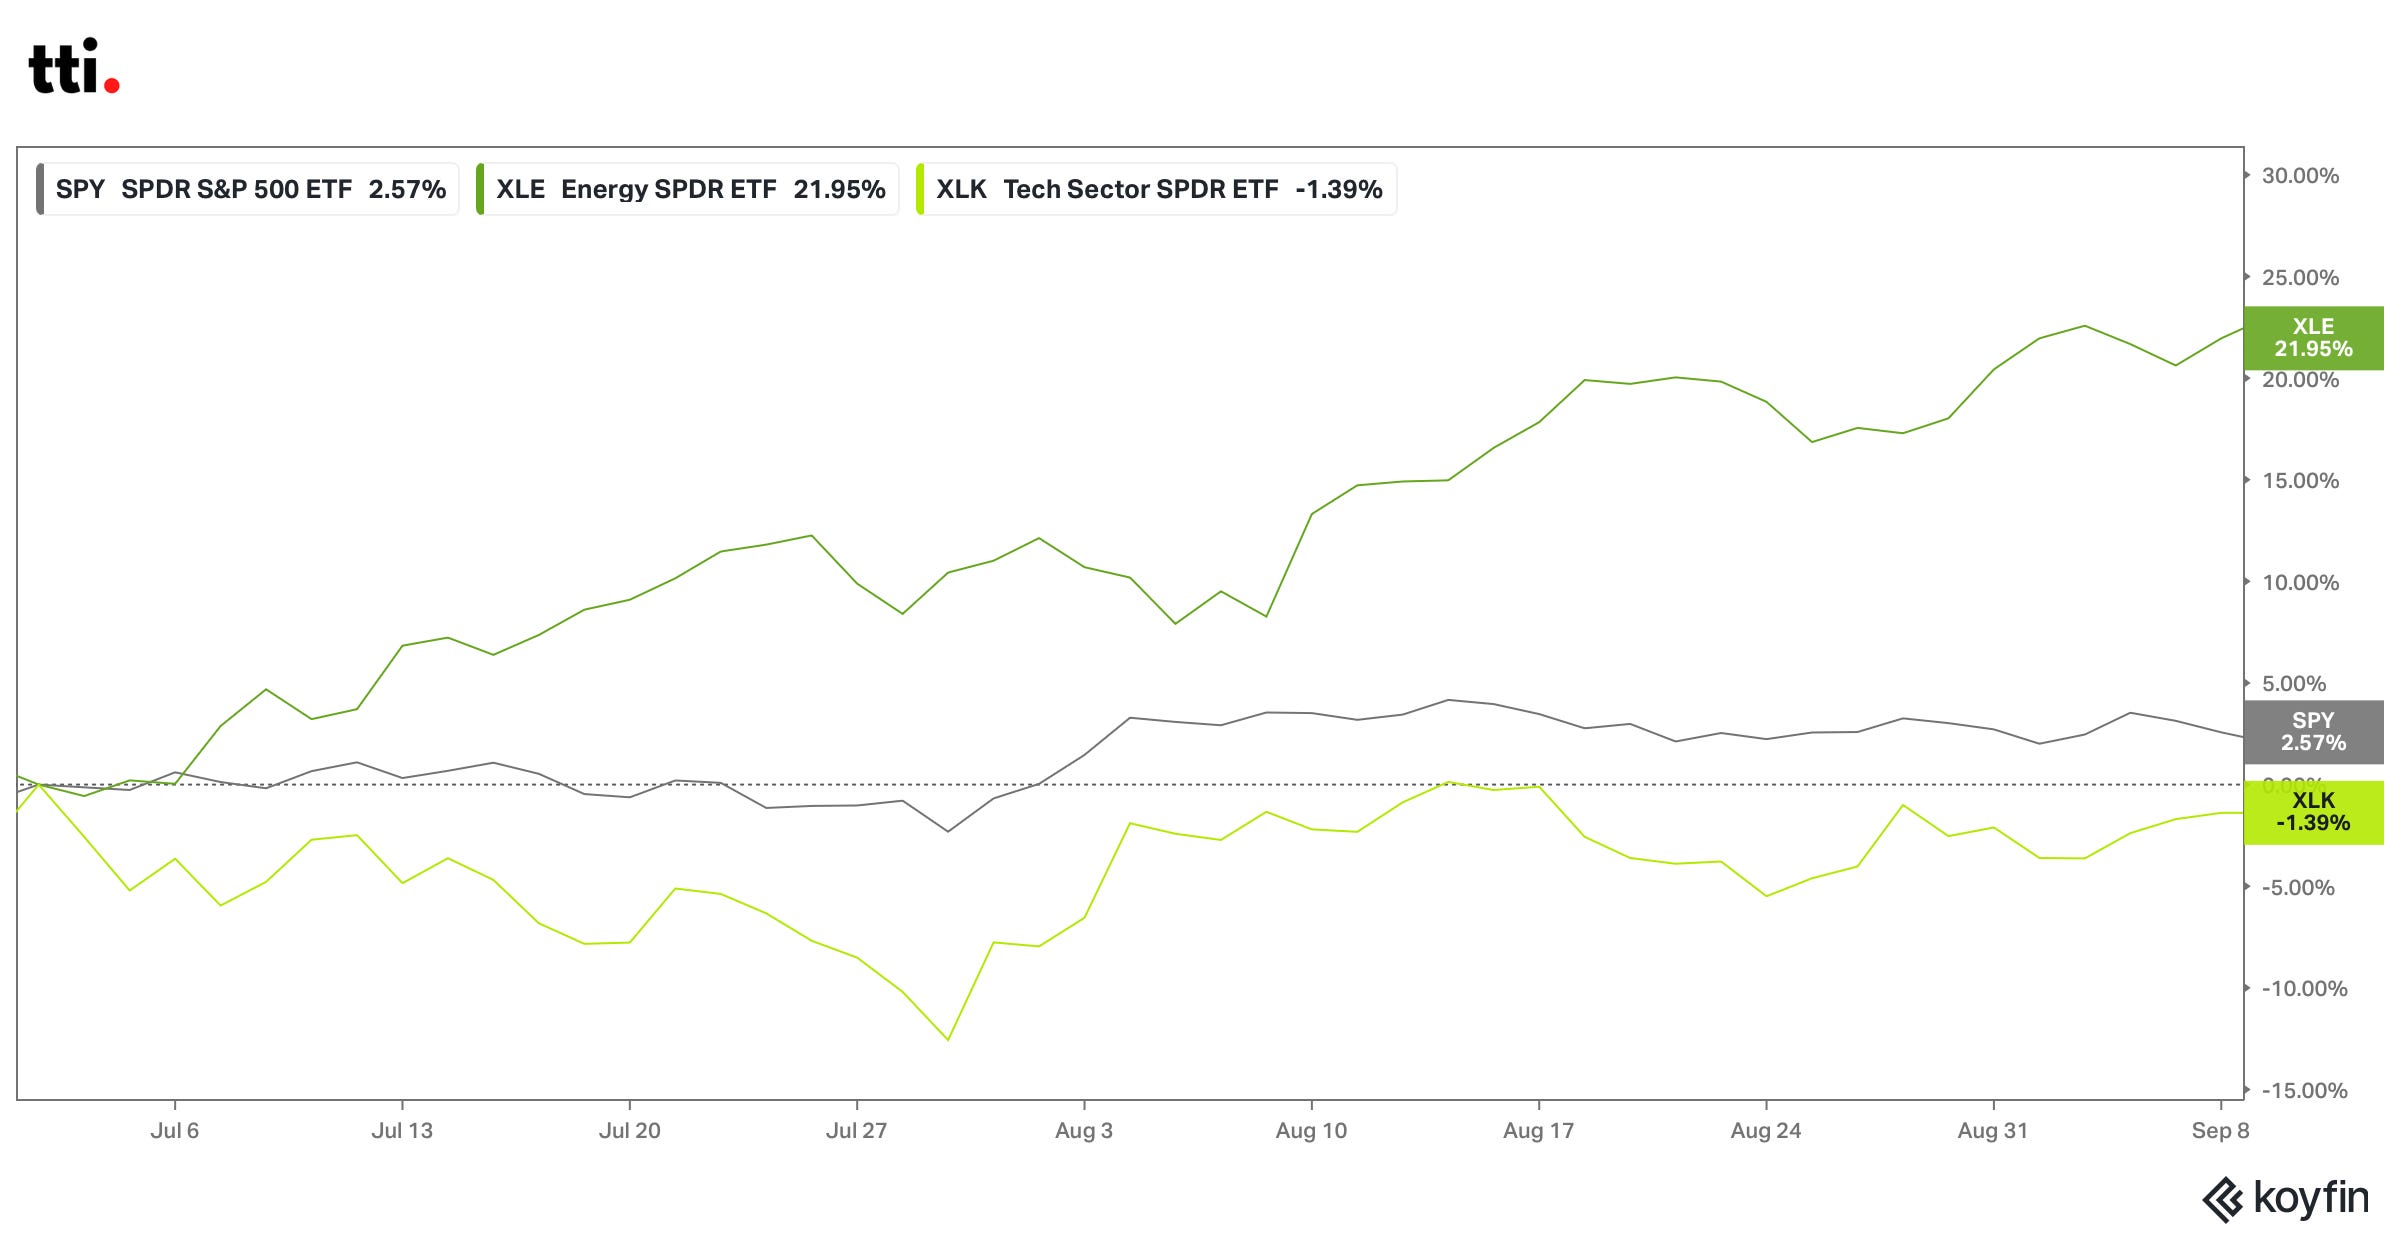
Someone could believe deeply in Technology’s long-term importance and still recognize that Energy had been the stronger sector over that period.
Both observations could fit in the same process. The longer-term belief wouldn’t need to disappear for the research list to change.
That comparison alone wouldn’t tell me which Energy stock to buy, whether its move was already extended, or whether Technology contained an excellent individual setup. It would give me a reason to spend time investigating a part of the market I might otherwise overlook.
The names at the top of the table will change. That’s exactly why I want a method for comparing them.
If I build my process around one sector always leading, eventually I’ll have to choose between defending the process and responding to the market.
I’d rather build the ability to change my list.
The industry is where the search gets interesting
Thomas Bulkowski explored this in his Industry Relative Strength study. He tracked 512 selected stocks across 44 industries from January 1995 through November 2007, ranking the groups by their previous six months of price performance.
In one test, he bought all the stocks in the top-ranked industry and sold when its rank fell below 14. Across 114 trades, he reported an average gain of 28.1% per trade, compared with 2.3% for the S&P 500 over the same holding periods.
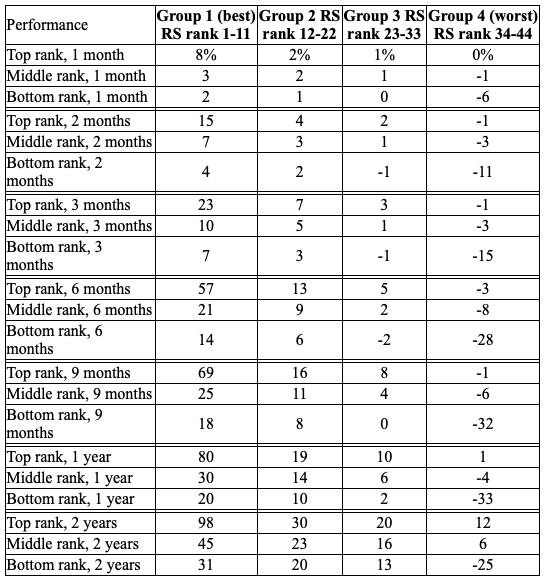
The industry you choose can make a substantial difference to your trading returns. In Bulkowski's test, buying industry leadership produced a much stronger average result than the benchmark over matching holding periods. That's why I want strength in the sector, the industry, and the stock: I'm looking for several forces that can help a trade become profitable.
Imagine a sector that’s outperforming the market. You look inside and find three different conditions.
One industry has several stocks trending higher and holding their gains. Another has bounced sharply after months of decline. A third is being carried by one unusually strong company while most of its peers struggle.
The sector ranking put all three in front of you. The industry work gives you reasons to treat them differently.
For a trend-following approach, I’d investigate the first group closely. I’d want more evidence that the second group’s recovery could hold. In the third, I’d examine the leading company’s specific strength and the weakness around it.
Those are research priorities. None of those descriptions supplies an entry.
Now take the first industry. Several stocks look constructive, but one has already run far from a sensible point of invalidation. Another is forming a tighter consolidation. A third keeps failing to hold breakouts even while its peers advance.
A trader attached to finding something that “hasn’t moved yet” may be drawn to the third stock. It’s easy to imagine the upside if it catches up.
But lagging can also be evidence. What explains the stock’s failure to participate in favorable conditions? What would have to change before its chart earns more confidence?
I want to answer those questions before treating the distance to a previous high as an opportunity.
This also leaves room for exceptions. A strong stock in a weak sector may have a company-specific catalyst worth researching. I want to understand the exception well enough to make a deliberate decision about it.
Working from the top down gives me a starting order. I still have to think at every step.
Eventually, the chart has to offer a trade
This is where a good research process can become dangerous if you ask it to do too much.
You’ve identified a strong sector, found an industry with broad participation, and narrowed the list to an individual leader. After that much agreement, buying can start to feel like the natural conclusion.
There’s still work left.
Where would the trade begin? What would price and volume need to do? Where would the setup fail? Can you take that risk at an acceptable position size, given the other positions you already hold?
For example, suppose the stock is consolidating beneath resistance. A possible plan could require price to clear that resistance with volume supporting the move, along with a defined level whose failure would invalidate the setup. A trader using a retest entry would need to specify what a successful hold looks like before placing the trade.
The details depend on the setup. They need to exist before the order.
If the stock runs too far before entry, the distance to invalidation may make the trade unattractive. If earnings are approaching, that event may change the risk. If the trigger never appears, the research can end with a stock on a watchlist.
Take our current position on Dropbox (DBX) as an active example (as of today):
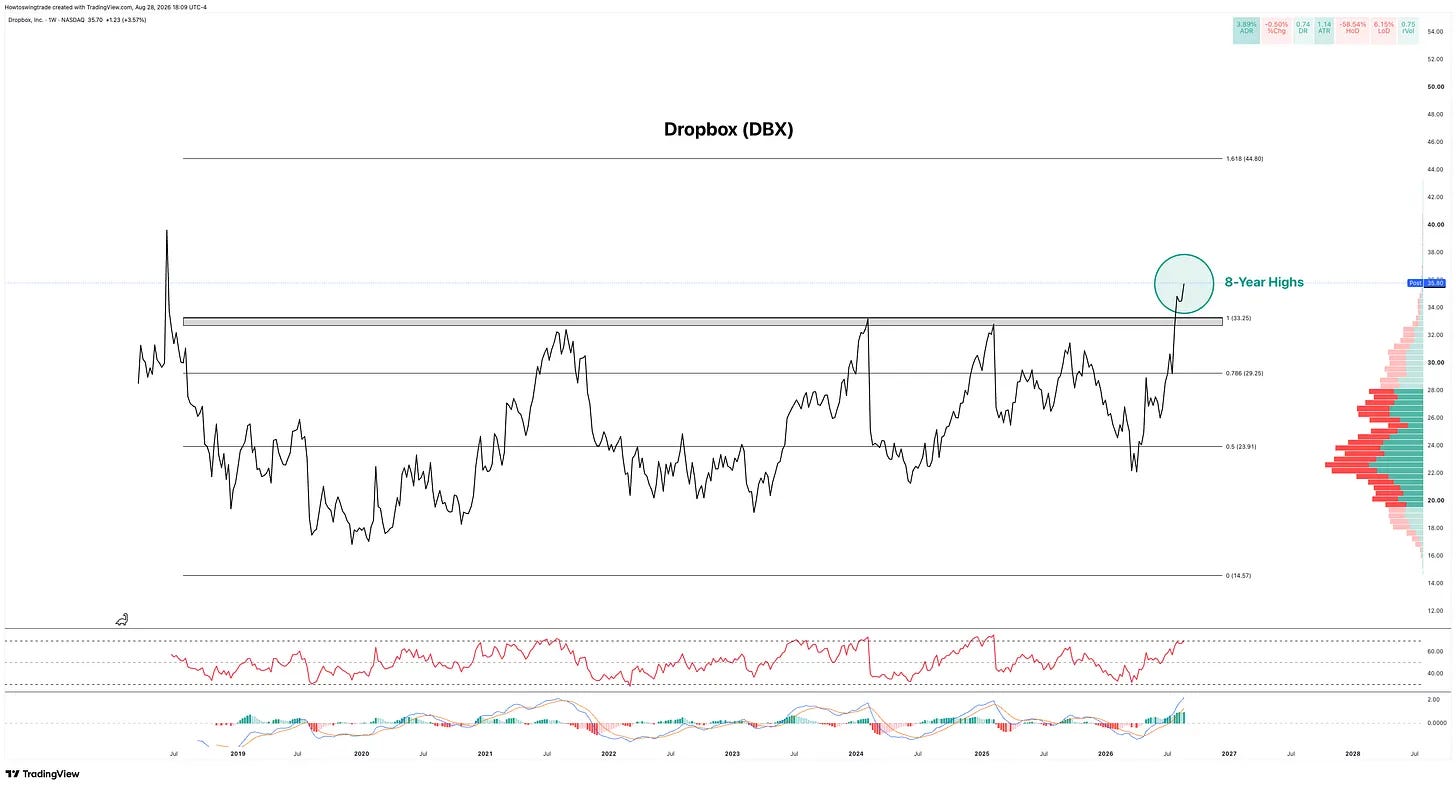
The technology sector has been volatile but the software industry has shown characteristics of new leadership and DBX ticked all of our boxes for a breakout we wanted to own.
I went into deeper detail on how we set up our trades in my How We Found Dropbox Before the Breakout article.
You don’t have to turn every useful observation into a position.
There’s also a portfolio consequence to finding several attractive stocks in one industry. They may respond to the same event and weaken together. The group strength that helped you find them can become shared exposure once you own them.
Three ticker symbols can still leave a lot of your risk tied to one underlying idea.
That’s another reason the group belongs in the process all the way through to position sizing and management.
Change the way you build your watchlists
The practical place to start is the list you already have.
Beside each stock, write its sector and industry. Then write one sentence explaining why it deserves attention now.
You may discover that a list of twenty stocks is mostly a view on two industries. You may find a name you’ve kept watching for months because you once traded it well. You may also find good ideas whose place on the list is easy to explain with current evidence.
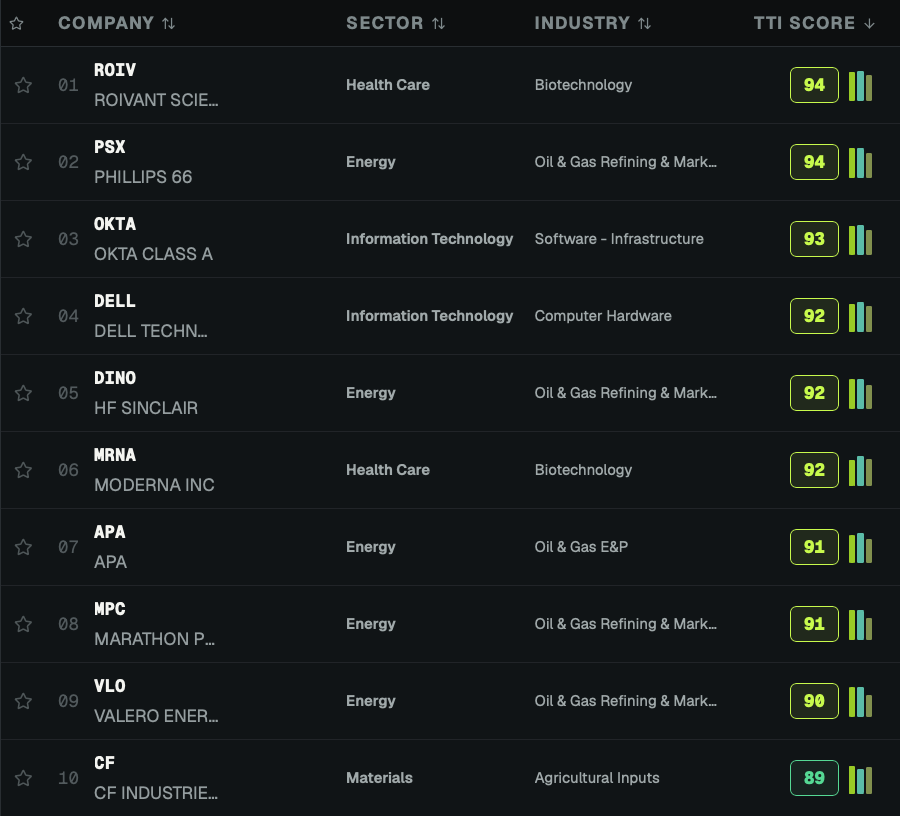
For example, as of today there are five energy-related stocks in our top ten strongest stocks universe: PSX, DINO, APA, MPC, and VLO.
While all five of these stocks could certainly be great stories, the odds of a stronger sector and industry push are the likely reason.
That exercise tells you something useful about how you’ve been allocating your attention.
Then choose a regular review cadence that fits your holding period. Compare groups over consistent intervals, look at participation, inspect the industries underneath, and bring the strongest relevant candidates into your chart work. A shorter window can help you notice change; a longer one gives that change context.
Keep the comparisons consistent enough that you can tell when the evidence has changed. Continually switching timeframes until a favorite stock looks good defeats the purpose.
For each candidate, record what earns further attention, what would trigger a trade, and what would make you pass. Revisit those reasons when you review the list.
You can also apply the process to an idea found from the bottom up. When a scanner produces an interesting stock, work back through its industry and sector before deciding what the result means.
Over time, that gives your watchlist a way to admit new opportunities and release old ones.
This is the connection we work on inside The Trading Initiative: using market context and stock research to build trade plans with clear triggers and risk. The TTI Trade Desk and live coaching support that process. You can learn more about Membership here.
The ability I want a trader to develop is independence from any particular list of names.
You can have favorite businesses. You can have ambitious ideas about the future. You can study a company for years and still decide that another part of the market deserves your attention this week.
There will always be more stocks than you have time to understand. Part of becoming more deliberate is learning what deserves that time, and allowing the answer to change.
Before you open the same chart again, give yourself a moment to ask why it’s still first in line.
If you want to read my thoughts every morning, sign up here for free below:
I write about capital flow, market cycles, sector rotations, hot tipz on stocks, and whatever else I think is cool.
Feel free to reply back to any of the newsletters and talk shop.
And follow me on the other platforms..
Bulkowski the man, never knew about his site until I joined TTI