

founders’ note: i spend a lot of time looking at what’s happening in the market right now. which stocks are leading, where the money is moving, and where the next trade might be.
but there’s another question worth asking: what happened the last time the market looked like this?
that’s where randy comes in.
randy is the guy behind randy’s daily print, where he digs into market history, statistics, and the patterns that most traders probably aren’t paying enough attention to.
we’re swapping newsletters today so you get a different perspective from someone who spends just as much time obsessing over this stuff as i do.
here’s randy.
hamilton
There are a thousand different things you can look at when it comes to assessing the market.
Maybe a little bit more than a thousand.
But, over time, I’ve figured out that less is more.
See I’d much rather have a few tried and true indicators that work instead of hundred of them that are hit or miss.
The VIX is one of those indicators that I constantly rely on.
First, what even is it?
The VIX index tracks how much the S&P 500 is expected to move over the next 30 days. Some people refer to it as the “fear gauge” or “fear index” because it usually jumps when stocks fall.
We can see that visually just by looking at the two indexes over time:
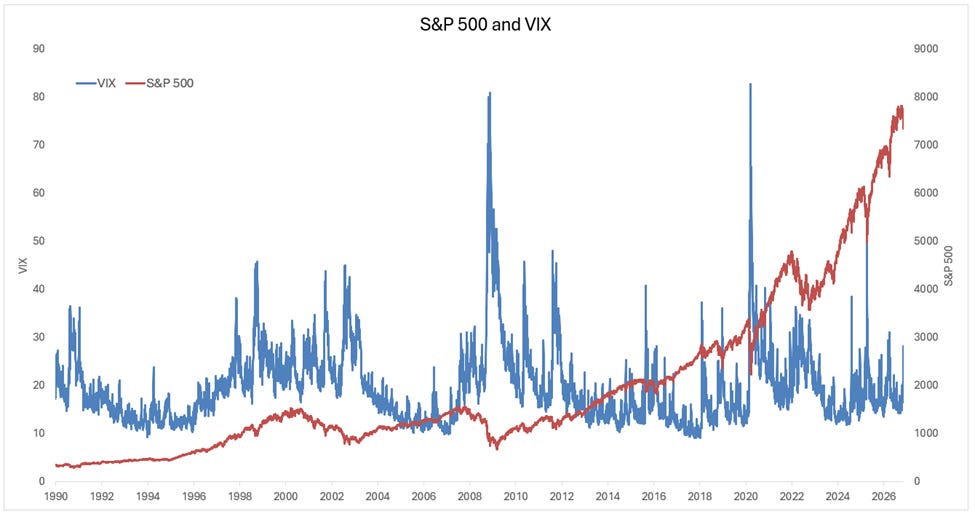
But we can also see it by looking at the relationship between daily moves in the VIX and S&P 500:
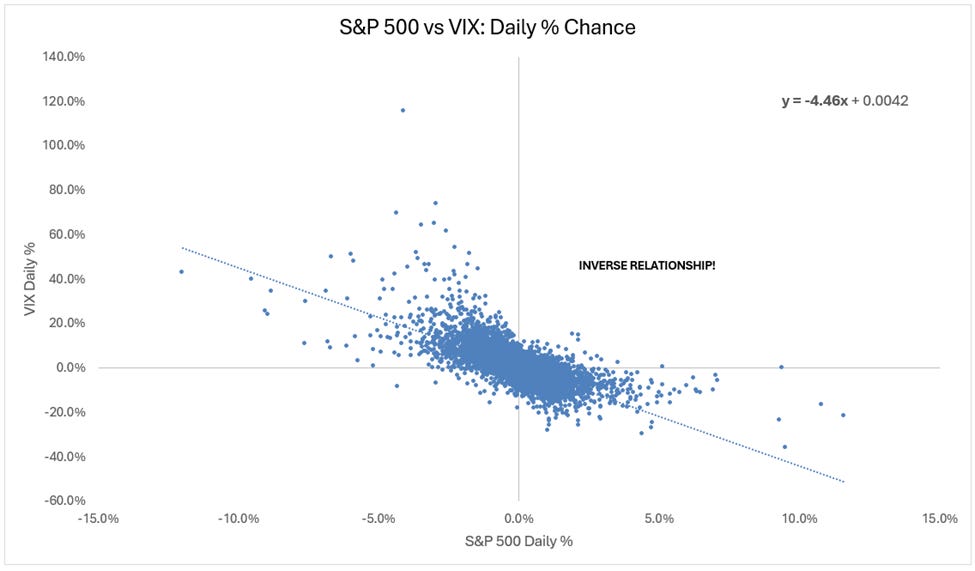
When VIX goes up, stocks go down and vice versa.
Now it doesn’t happen all the time. The correlation of daily S&P and VIX moves going back to 1990 is -0.70 — not perfectly inverse.
But it happens most of the time and most is good enough for me.
Great, now how do we use it?
There are two ways:
By understanding the volatility regime and how that affects forward S&P 500 returns.
By taking advantage of VIX spikes.
If you like what you’re reading so far, subscribe for free to my Daily Print. I send a 2-3 minute newsletter out every morning with something important for your portfolio to think about.
Let’s tackle the first one. Volatility likes to move in regimes. In bull markets, you’ll usually see low volatility. In bear markets, you’ll usually see high volatility.
We can see that when we look at the VIX and S&P during the 2022 bear market and coming out of it.
Notice how VIX stayed mostly between 20 and 36:
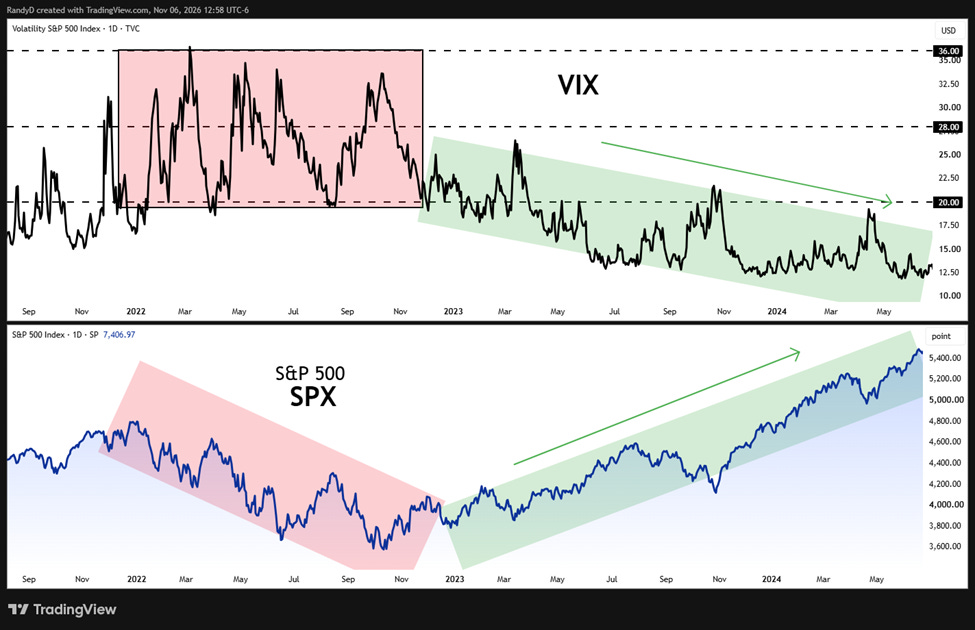
This was most definitely a high-volatility regime, especially considering the long-term average for the VIX is around 19–20. But as we came out of that bear market and entered a new cyclical bull market, the VIX shifted into a low-volatility regime.
By the way, the lines you see on the chart aren’t support and resistance levels.
They’re statistical levels based on standard deviations.
You’ll notice that these levels sometimes act like what technical analysts would call support or resistance, although I wouldn’t recommend applying basic TA principles to the VIX.
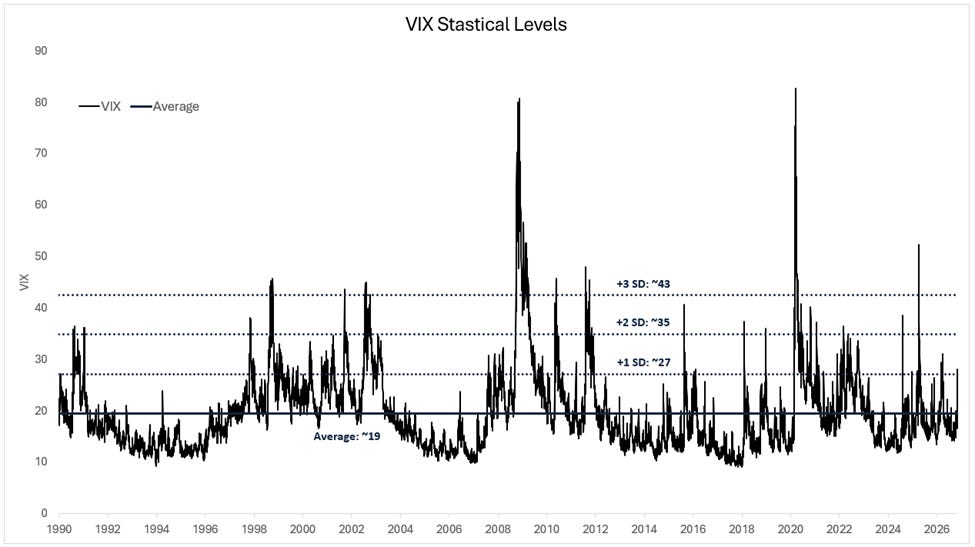
Here are the important levels:
Long-term average is ~19 to 20.
+1 standard deviation is ~27 to 28.
+2 standard deviation is ~35 to 36.
+3 standard deviation is ~43 to 44.
Now, you might be asking: “Why do the higher VIX regimes show higher future returns if high volatility is supposedly bad for stocks?”
Here’s the thing…
There’s a difference between living in a high-volatility regime and experiencing a sudden spike in volatility.
A high VIX tells us the market is pricing in a lot of uncertainty. But when volatility spikes, it can also signal that fear is reaching an extreme.
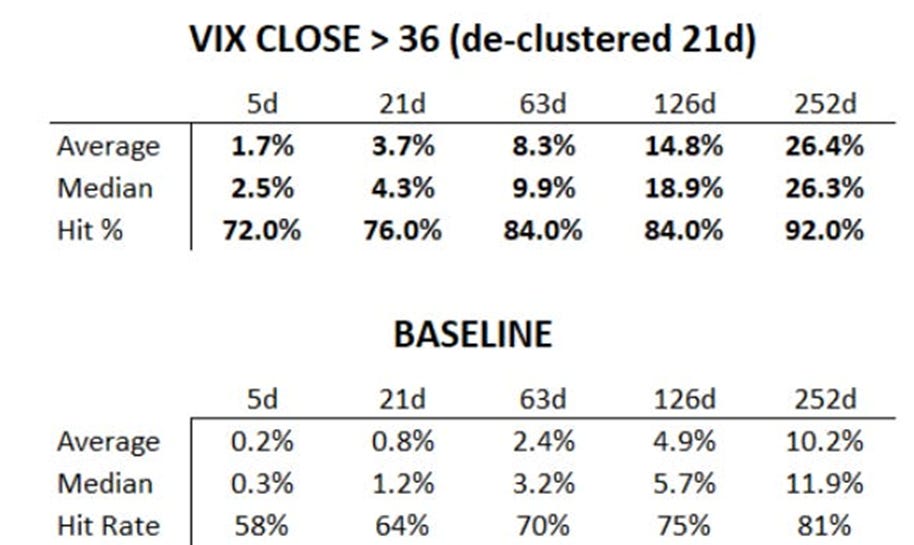
For example, when VIX closes above the 36 handle, forward S&P 500 returns are very attractive:
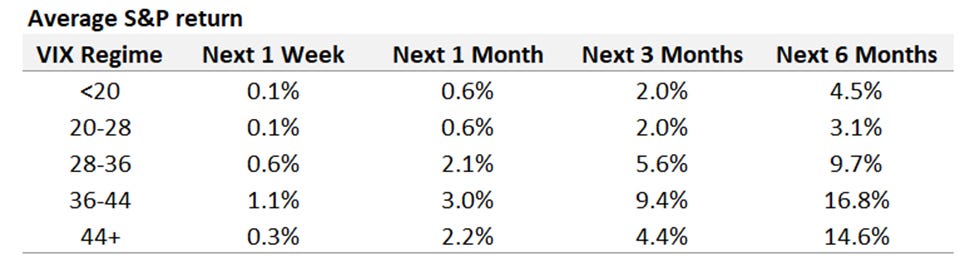
And that’s because a VIX of 36 rarely happens near all-time highs.
It happens when…
→ the market is under stress
→ investors are panicking
→ things look flat out ugly
And that brings up a pretty important question: “How do we know if a VIX spike is just a spike or if volatility is entering a new, high-volatility regime?”
Sorry to say this, but I don’t!
A lot of the time, I’ll commit a very small amount of capital on VIX spikes and see how the market reacts. If we see a strong move off the lows, I’m more inclined to believe we’re dealing with a spike in volatility rather than a new high-vol regime.
If we don’t see a strong move, that’s when I think volatility is transitioning.
Of course, this isn’t a perfect process. It’s just how I approach it.
So I look at VIX in two ways:
I’m always watching for volatility to transition into a high-volatility regime. This can be an early sign that the market environment is changing.
I’m looking to buy fear when the VIX spikes to meaningful level (i.e, 36, 44)
There’s honestly a fine line between the two.
But over the years, I’ve found VIX to be extremely useful in understanding market environment.
Are you looking to buy fear when the VIX spikes to historically high levels? Or is this time different? Let me know what you think.
Markets often rhyme,
Randy
Analyst, The Trading Initiative
PS. If you liked the newsletter today, I’m inviting you to subscribe to my free Daily Print.
I’ll send you one important idea and chart every morning that will make a positive impact to your portfolio. I look forward to talking with you every morning!