


I’ve been doing this long enough to know how difficult it can be to buy when the reasons to stay away still make sense.
Rates are higher. The market has been pulling back. You can make a perfectly reasonable argument for being cautious.
I have been cautious.
But this morning I’m seeing something that makes me willing to take more risk.. stocks I’ve been stalking are starting to act better while investor and trader sentiment has become worse. A lot worse.
I think yesterday may have been the washout. And I think it’s time to start buying again.
Let me show you what I mean.. because there’s a big difference between that and buying everything under the sun.
The fear is already here.. and it’s expanding
The latest AAII survey puts bullish sentiment at 28.8%. Its historical average is 37.5%.
Bearish sentiment is 53.3% compared with a historical average of 31.5%. A week earlier, it was 39.3%. The bull-bear spread is now −24.5 percentage points.
There are more people afraid to buy stocks right now than at any point in the last year:
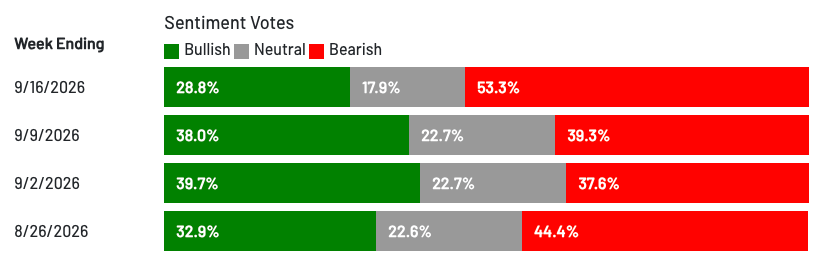
This is a weekly survey about the next six months. It doesn’t take into account today’s rally and I wouldn’t necessarily attribute the whole thing to yesterday’s Fed announcement.
But what it does give me is context. A lot of people are already leaning bearish.
And maybe they are right. They certainly were back in early 2025. There’s nothing clever about buying a stock that keeps falling because you’ve decided everyone is just too pessimistic
There’s a fine line between being contrarian and being an asshole. Many dance on both sides.
What really gets my attention is when pessimism stops confirming what I’m seeing through price action. The reasons to sell may still be there but the selling itself large stops. Then individual stocks begin breaking out.
That’s when I know that something has fundamentally flipped.. and it’s time to act.
Yesterday may have cleared something out
The Fed raised rates 25bps yesterday.. taking the target range to 3.75%-4.00%.
The move was expected. The Fedwatch tool had a 92% chance of a rate hike heading into the FOMC decision. But the messaging that accompanied the rate hike left room for more potential hikes.. 16 of 18 Fed voters projected at least one more increas this year.
Stocks were higher prior to the announcement and took a nose dive once Warsh started talking. But I want to be careful with the whole “washout” thing.. the S&P 500 closed down 0.4% and the NASDAQ was basically flat.
It’s what was going on under the surface that mattered more. SPY traded roughly 1.5 times its previous 20-session average.. and finished above its intraday low.
So my view is that we may have seen a flush near the end of this pullback.
If it looks like capitulation, sounds like capitulation, and smells like capitulation.. you buy the accompanying rally over the next week and ask questions second.
Some of the best buys you’ll ever make are going to be from bottoms formed by traders and investors begrudgingly tapping out and selling their positions.
And from their misery comes our opportunity.
Here are two things I am looking to buy today
SPCX and INTC are the two charts I want to focus on here.
SPCX is the first range breakout I’m looking at.
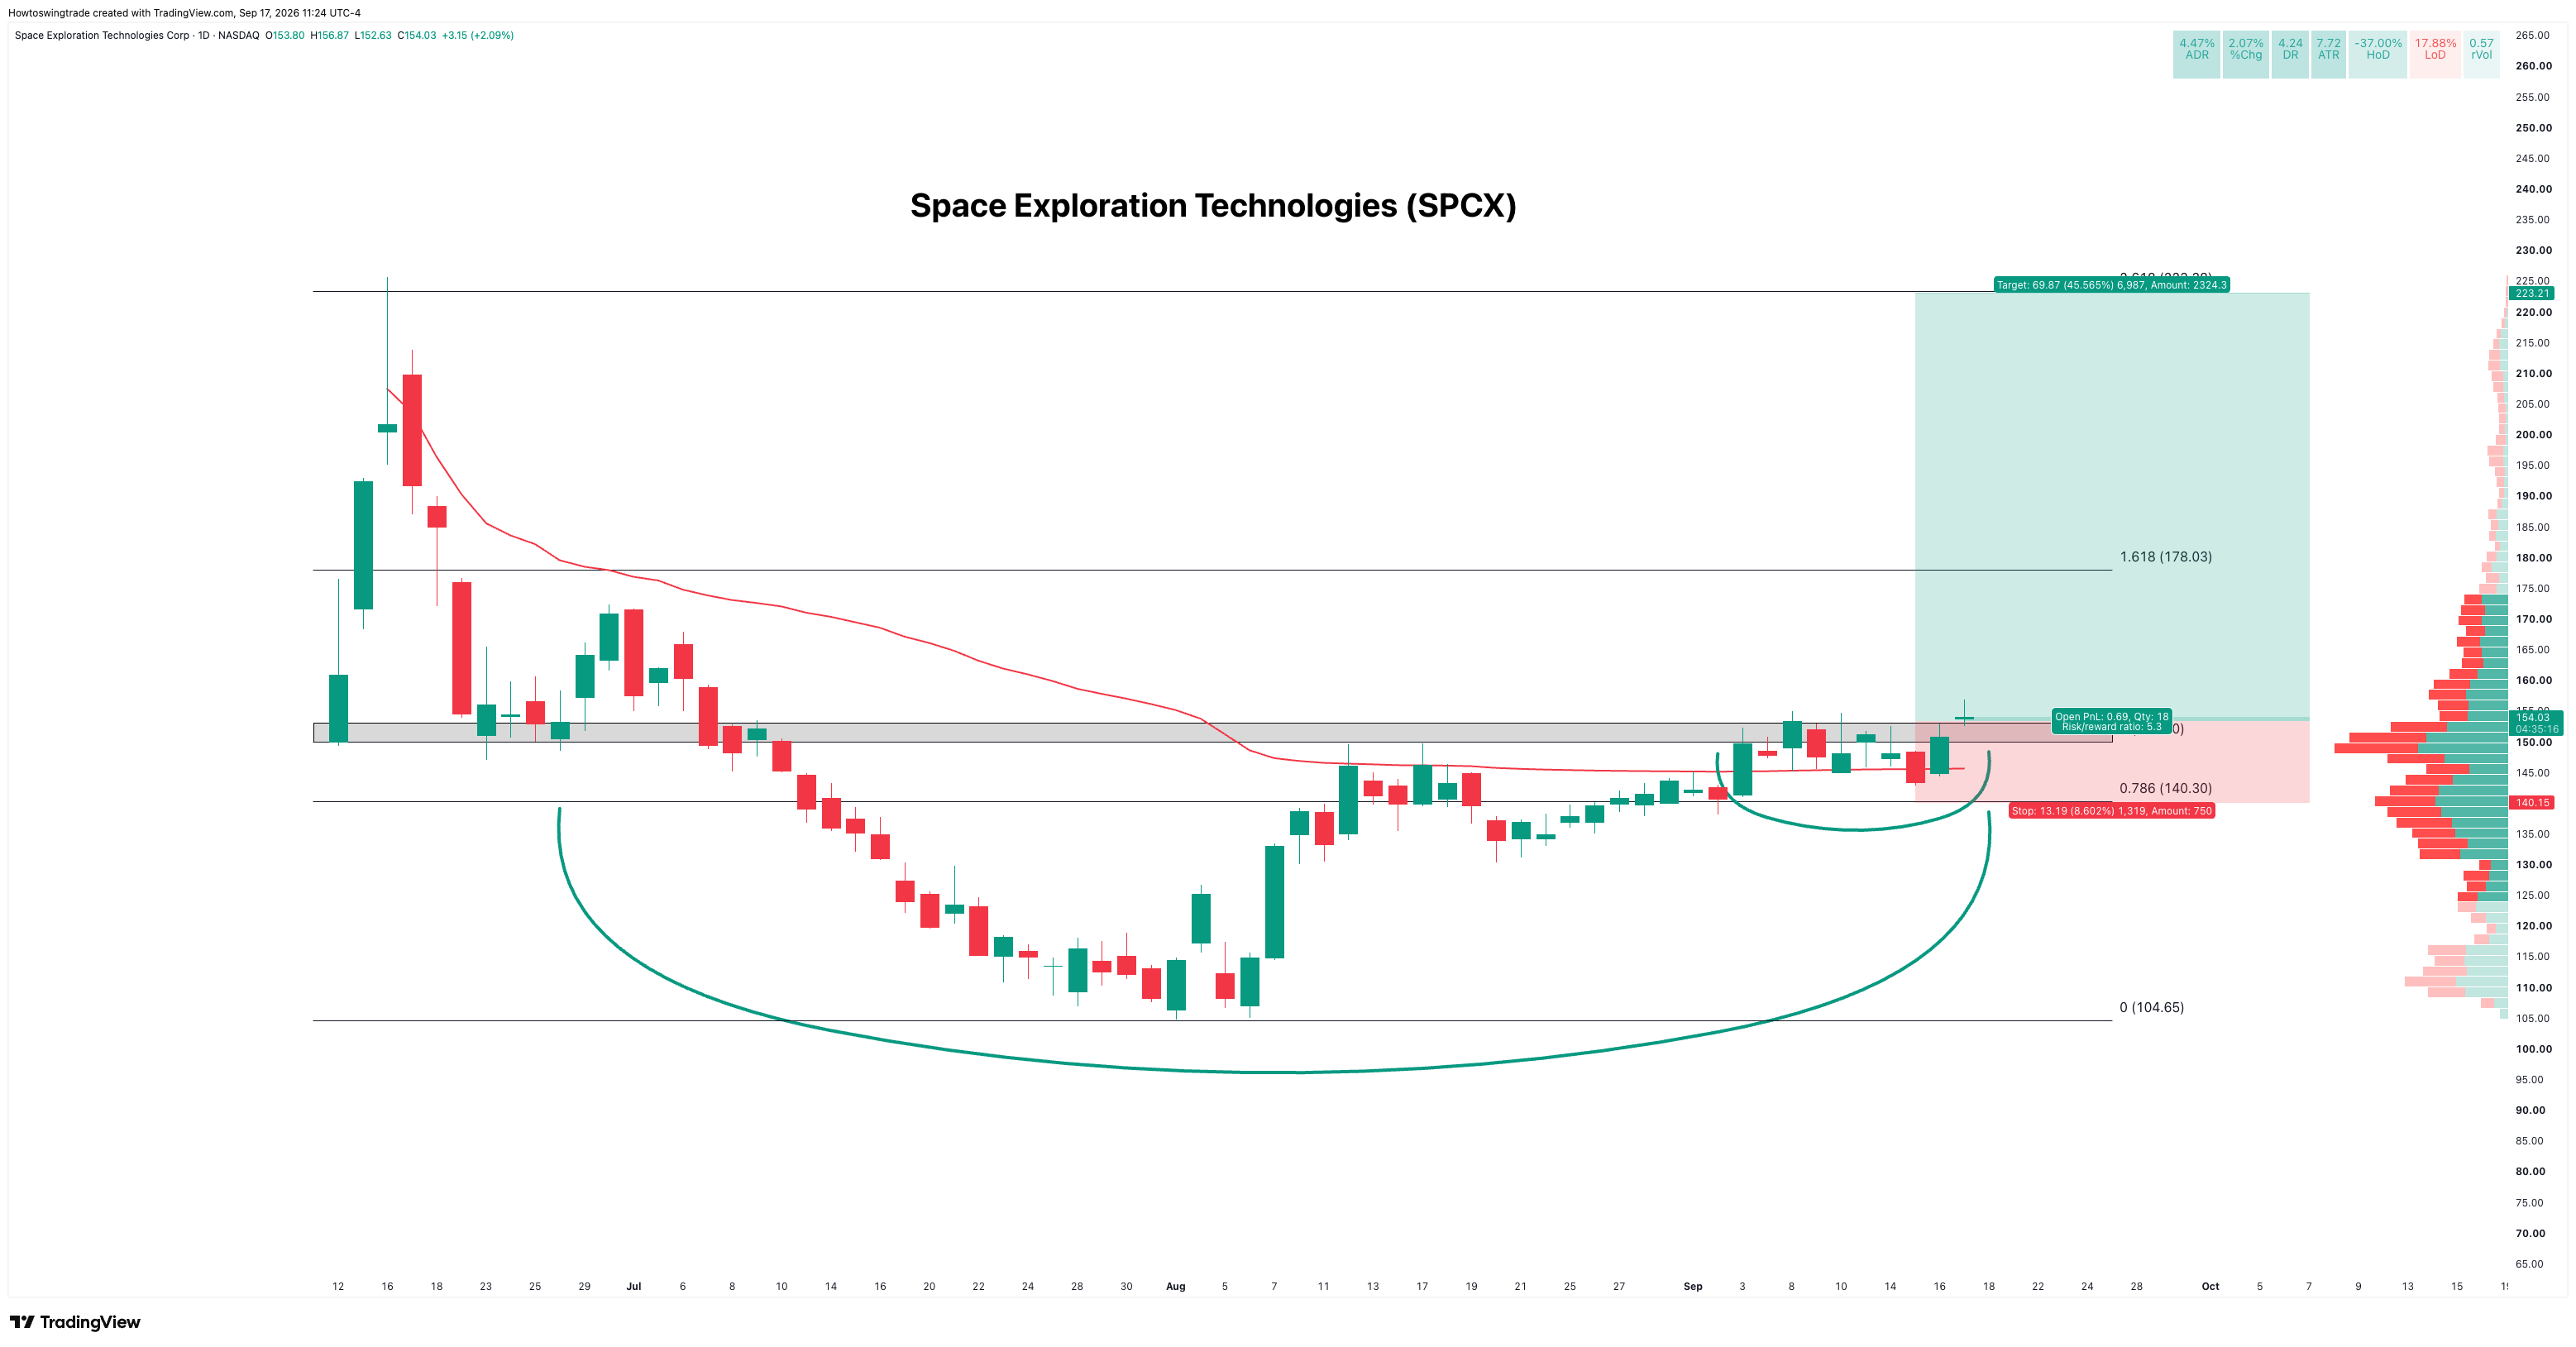
There’s a lot going on here so I am going to do my best to summarize it briefly..
The range SPCX has traded in over the last few months give us a durable base to buy a breakout from.
The bottom of the range is clearly marked near 104.50 and the top of the range is sitting somewhere around 153.00.
The VRVP indicator (the volume bars on the right) show us volume by price. That’s important when establishing whether a range is a durable base to buy the breakout from. In this case.. it is as the volume appears more like accumulation than distribution.
The anchored VWAP from the all-time highs shows us the average fill price based on volume. It gives us another tool to see if the average fill is in profit or at a loss at current prices. It also acts as a dynamic support and resistance level to base risk around. In this case.. the AVWAP is sitting around 145.50, offering dynamic support as price trades above it.
A breakout above the 153.00 neckline (and close) shifts the path of least resistance for price higher. The durable base that has been building should act as support on any pullback in price. And trend should then shift higher towards our profit targets.
Entries, stops and take profits have their own set of rules: nothing less than a 3:1 setup is looked at, with a preference for 4:1 or higher.
An entry at the 153.00 area gives us a fighting chance to catch the breakout above the durable base.
Stops are more complicated. I use a combination of price structure, volatility, and common sense.
With a 4.47% ADR, SPCX is considered a relatively high beta trade. That means any volatility-based stop would need to have (at least) a 2-3xATR move to give the trade enough room to breathe.
A 2xATR move at 140.50 would put it right underneath the most frequent base fractal that has been built out. This gives my stop two opportunities to hold: one based on previous price action and the other based on volatility.
Then we shift our attention higher towards the price target. The 1.618 fib extension is generally my first price target. But in the case of SPCX, given that its a recent IPO and that there is virtually no overhead resistance to fight through (based on the VRVP), my price target shifts to the 2.618 fib extension for a potential all-time high breakout.
The totality of the trade offers a 5:1 reward-to-risk setup.
There’s also an opportunity to add an additional sleeve of convexity through the options chain. I won’t get into our process for deciding which options contracts to play as that could be an entire article in of itself.. but if you’re interested, join TTI and come learn and earn with us!
INTC is the other example.
Intel gained about 4% yesterday, while the broad market struggled. And it’s up another 9% today at the time of writing this. That’s called relative strength.. and I want to own it.
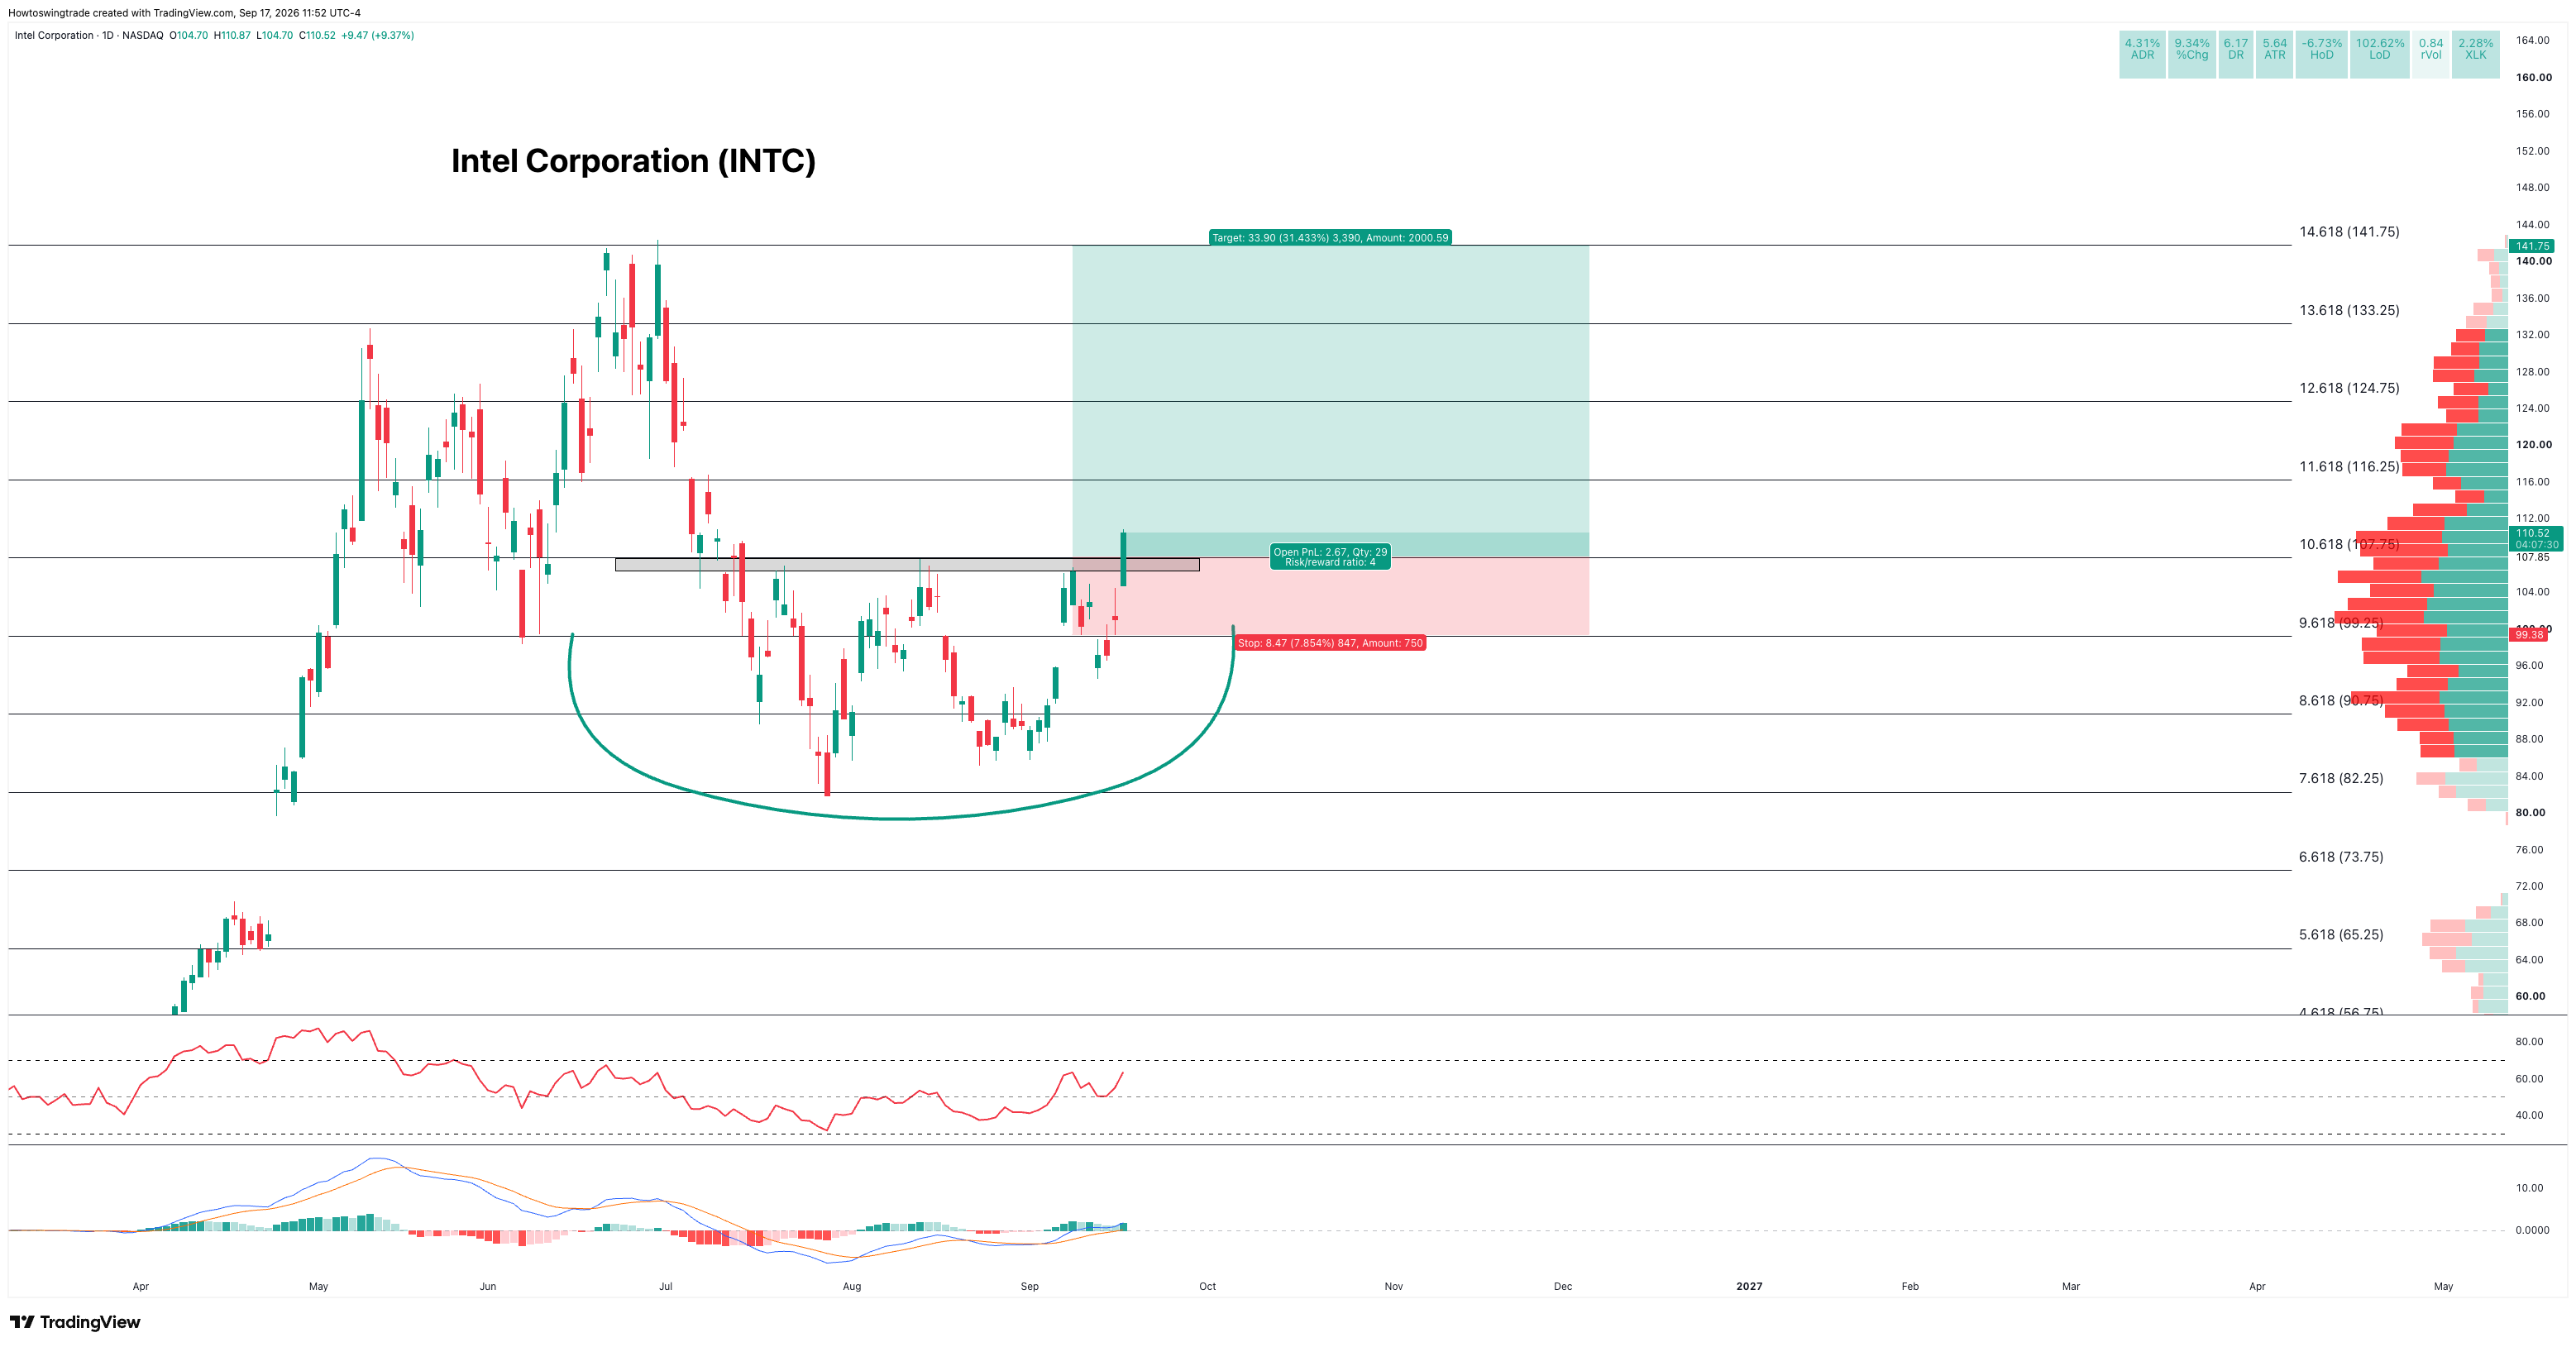
The trade idea follows the same logic with the additional to a momentum angle — INTC is trading within a bullish momentum regime and as of today is showing a acceleration of bullish momentum.
We also added a sleeve of convexity here. The options chain is a fantastic way to add some leverage to the trade without sacrificing risk as the deeply discounted contracts offer an incredible R:R.
Developing these trade ideas is part of our bottom-up process called our Hit List framework which works in tandem with our top-down process called our Market Blueprint framework. Combining these two processes gets us into the right stocks at the right time.
Note: TTI may have taken both of these trades by the time of this Substack article’s posting. Neither of these are buying or selling recommendations. They simply walk through the thought process of why and how I am trading these.
This is what separates TTI and myself from most of the rest of the market.. we don’t trade off of vibes or second guesses.
The rules are simple:
Trend tells me the direction of the stock. Relative strength tells me how it’s doing against the market. Momentum tells me whether the move is gaining or losing traction. The horizontal level gives me a place to evaluate an entry.
However.. just because everyone hates the market right now doesn’t necessarily mean I’m going to go out and buy everything.
That’s the part of being contrarian right now that I think gets lost with most people. When sentiment gets this negative, I pay closer attention to stocks that start contradicting it. Because when things stop doing what you expect them to do.. it’s time to act.
What I’m changing about it right now
I’ve been cautious ever since the Leopold Aschenbrenner blow up in June.
The AI-trade blew a hole in the market so big that you could stuff half of Substack’s authors egos into it.
But I’m increasing my willingness here to buy the areas most impacted by the AI-trade.. semiconductors, software, industrials, etc. As a matter of fact, I’m aggressively looking to buy them.. as is evidenced by todays INTC and SPCX buys.
That’s what I mean by “it’s time to start buying again.”
There may be a retest. Some of these breakouts may fail. If the indexes lose the recovery structure and the stocks leading this move start failing their own levels, I’ll reduce risk again. I’m not going to keep adding because I wrote about an opportunity today.
I could be wrong about the washout. Each trade still needs a defined exit, and position size has to account for the fact that an exit can be worse than planned.
And if you’ve read this far.. RBRK, SWKS, AMD, etc all look really good too. But you can’t own them all.. so develop a process to find which ones deserve your money.
Inside TTI Membership, this is the work we do continuously: connect the market backdrop to the sectors and stocks offering setups, define the entry and risk, then manage what actually happens. Today’s read is one part of that ongoing process.
I’m writing this today as an opportunity for you to get inside my mind as someone who trades risk for a living. I have no idea if these trades will work or if the indexes truly have bottomed. But at least in a few weeks.. we’ll have the track record to talk about it.
Everyone’s scared. But there are trades to take.
That’s enough for me to get back to work on the long side.
Thanks for taking the time to read.
Hamilton