


Most traders don’t have an information problem.
They have an order-of-operations problem.
I know because I’ve spent 17 years in markets collecting information.
Charts. Indicators. Scanners. Economic data. Fund flows. Options data. Sentiment. Relative strength. Momentum. Every new tool promised to make the next decision easier.
Most of them gave me more things to look at.
Very few taught me what deserved to be looked at first.
When I was newer, I wanted every trade.
Every ticker felt like another opportunity to make money. Missing one could feel almost as bad as losing on one.
That’s what inexperience does. It confuses opportunity with obligation.
Seventeen years later, I know there will always be another trade. The harder skill is recognizing the few that deserve my attention, the fewer that deserve my risk, and the many that deserve a no.
That difference is where analysis paralysis begins. When every data point is allowed to speak at the same time, the loudest one usually wins. And the loudest one is normally whatever confirms the trade you already want to take.
Never a bad day to take a step back and look at the direction of the primary trend.
It’s arguably the most important part about all of this.
Which direction is the market moving on the higher time frames? That bias won’t make every trade work, but it can save you from repeatedly putting money behind an idea that needs the entire market to change direction just so you can be right.
I keep it simple..
The S&P 500 and Nasdaq-100 anchor my expectations. Then I build the supporting cast: semiconductors, the Dow Jones Industrials and Transports, the equal-weight S&P 500, mid caps, small caps, and the relationships that tell me whether the rest of the market agrees.
The goal is not to predict tomorrow. The goal is to establish order.
Market and asset context first. Sector next. Industry after that. Stock after that. Trade last.
Each layer has a different job. Trend gives me direction. Breadth builds my confidence. Sector and industry leadership narrow where I want to look. Financial conditions change how supportive the backdrop is. Intramarket and intermarket relationships confirm or challenge the story. The combination produces a market posture.
Only then does an individual stock get the chance to earn my capital.
A trade that has its back to the current will outperform one that doesn’t.
I am obsessed with aligning my trades and portfolio with the direction of the market.
Here’s how I do it.
Clarity comes from hierarchy
The solution isn’t throwing every tool away.
It’s giving each tool one job.
A breadth reading cannot tell me where to place a stop. A single stock chart cannot tell me whether the overall market has earned maximum aggression. An options chain cannot repair a hostile sector.
Evidence becomes useful when it’s ordered.
The longer I trade, the less interested I am in collecting every possible answer. I want a smaller number of questions with clearly defined jobs, asked in the correct order.
What’s the market doing?
How much of the market is participating?
Where’s leadership?
Does the supporting evidence agree?
How aggressive should I be?
This is the thinking behind the Market Blueprint, TTI’s internal top-down research process.
The market is upstream from the sector. The sector is upstream from the industry. The industry is upstream from the stock. And the stock is upstream from the actual trade.
A stock is the last link in a chain most traders never inspect.
Starting at the bottom makes every decision harder. You find the ticker, become attached to the opportunity, and then search for context that justifies it. Starting at the top reverses that pressure. The environment narrows the search before attachment enters the process.
That doesn’t remove discretion.
It gives discretion somewhere useful to begin.
The Market Blueprint moves in order: establish direction, measure participation, locate leadership, judge the financial backdrop, test the supporting relationships, then hand the result to stock-specific research.
The market isn’t the thing I’m supposed to control
Trading is a strange profession.
We’re paid through outcomes we can’t control, but the only thing we can actually improve is the quality of the decisions that came before them.
I can’t control what the Federal Reserve says next. I can’t control an earnings gap, a surprise headline, a forced liquidation, or what another trader decides to do with a billion-dollar position.
I can’t control whether the next trade wins.
The work that belongs to me is much less exciting.
What evidence do I require before I enter?
What price proves the idea wrong?
How much am I willing to lose?
Do I need to trade at all?
The Stoics spent a lot of time separating what’s up to us from what isn’t. You don’t need to become a philosopher to see the value in that. You see it every time a trader moves a stop because being wrong has become emotionally unacceptable.
A stop is a philosophical commitment made before emotion arrives.
Position size is humility expressed in dollars.
Patience is the ability to let an opportunity pass without treating it like a loss.
That’s not pessimism. It’s freedom from needing the market to cooperate with the story in my head.
Once I stop measuring myself by whether I predicted the next candle, I can begin measuring myself by something trainable.
Did I read the environment honestly?
Did the setup meet my rules?
Did I define the risk before the outcome was known?
Did I follow the plan after money and emotion became involved?
Those are skills.
Skills can be studied. They can be practiced. They can improve.
The primary trend is where that process begins for me.
It’s not a prediction. It’s a working bias for which direction deserves the benefit of the doubt.
I use the S&P 500 and Nasdaq-100 as my anchors. Then I check them against semiconductors, Industrials, Transports, equal weight, mid caps, and small caps.
The 40-week trend helps me judge the larger structure. The 10-week trend helps me judge the intermediate move.
There’s nothing magical about either line. Their value is consistency.
If the higher-time-frame evidence is moving higher, I’m generally more interested in buying weakness after the trend begins to resume than I am in betting that every pullback will become a major top.
If the evidence is moving lower, I treat strength differently. Long setups need to clear a higher bar. Failed rallies matter more. Strength can become something to fade rather than something to chase.
The words *generally* and *after* matter.
An uptrend is not permission to buy everything. A downtrend is not permission to short everything.
Bias is not certainty.
It’s a rule for which side has to prove more.
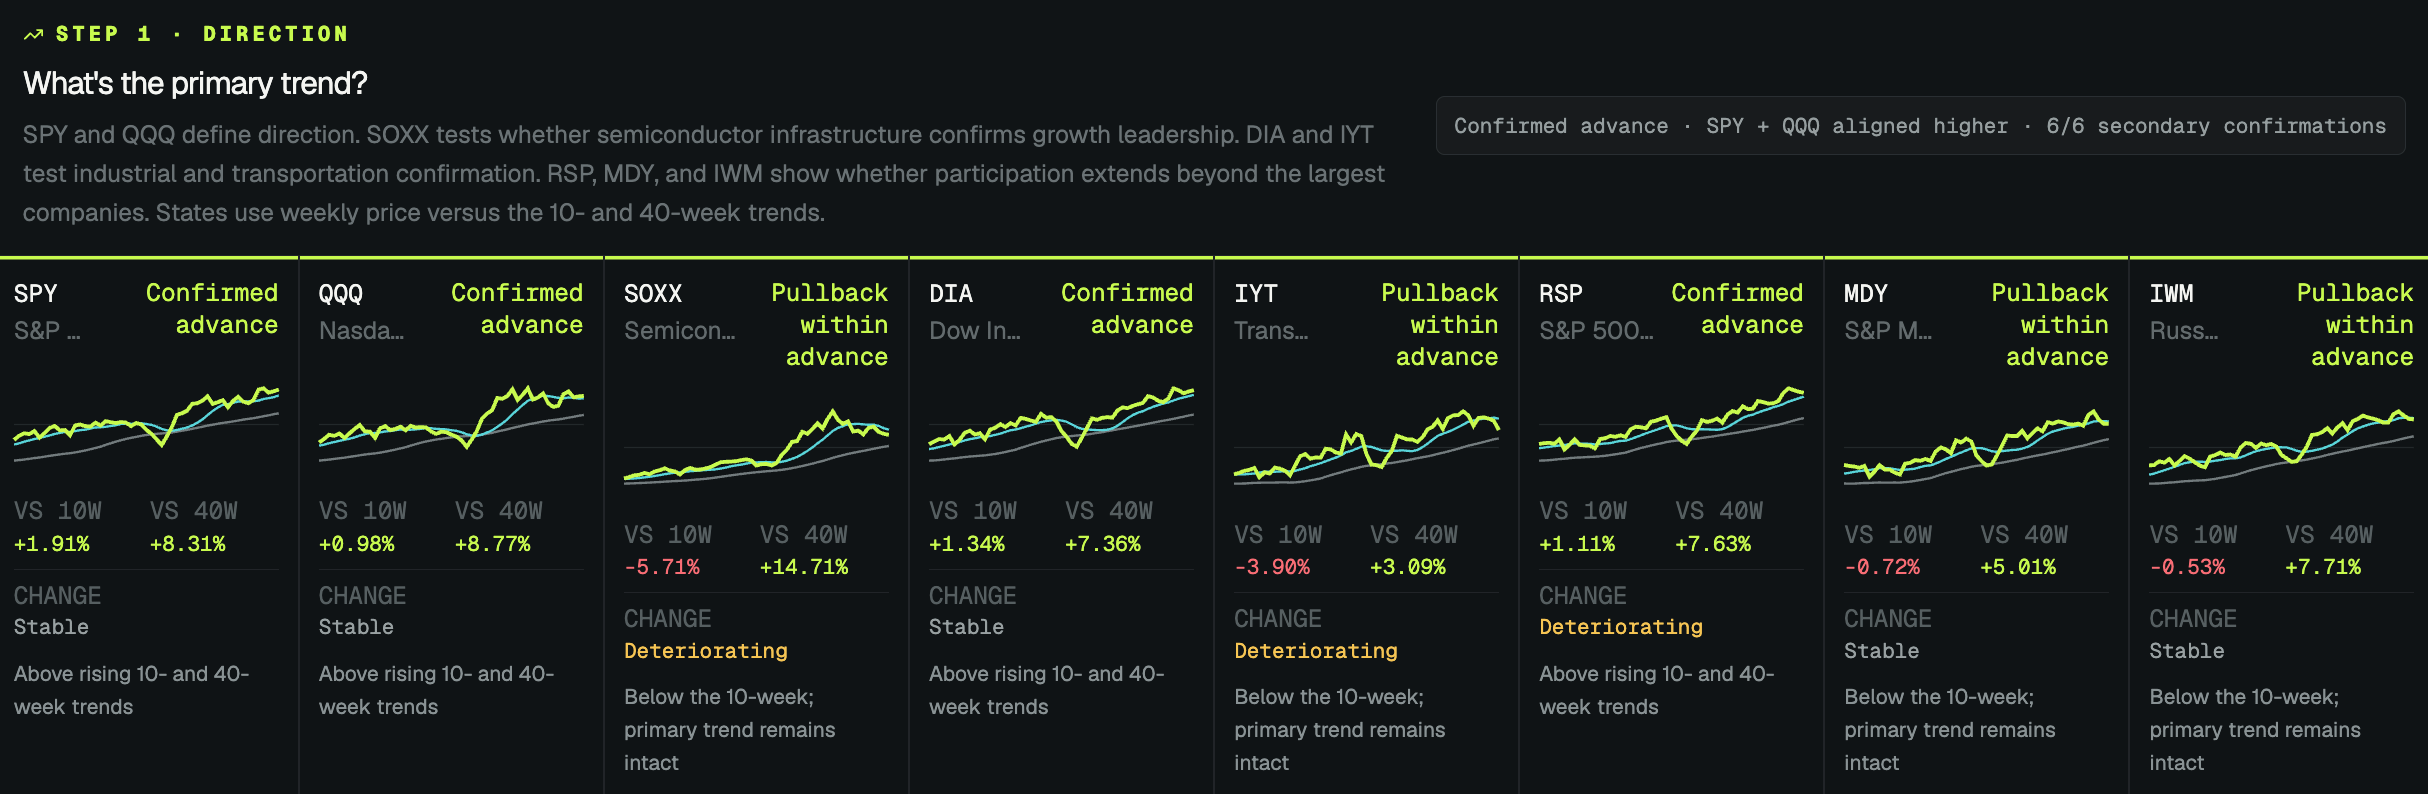
The primary trend was is still higher after today’s close, but the shorter-term picture has weakened. All eight benchmarks remain above their 40-week trends; four have slipped below their 10-week trends.
Direction is only the first decision
The S&P 500 can be near its highs while most stocks are struggling.
The Nasdaq-100 can look healthy because a handful of enormous companies is doing most of the work.
The index can be telling the truth and still leave out most of the market.
This is where breadth comes in.
An index tells me where the index is trading. Breadth tells me how many stocks helped it get there.
That distinction changes how much confidence I place behind the trend.
I can thank my friend Ryan for teaching me that.
If the index is advancing while participation expands across short, intermediate, and longer timeframes, more stocks are receiving an opportunity to work. If the index is advancing while participation contracts, the path can remain higher while the margin for error becomes smaller.
Same direction. Different environment.
That’s why direction and aggression have to be separate decisions.
A trader can be right about the market’s direction and still lose money by applying the wrong level of aggression. Buying every breakout, using full size, and giving mediocre positions too much room can turn a correct market view into a poor trading outcome.
Breadth helps prevent that.
I look at the percentage of stocks above their 20-day, 50-day, and 200-day averages because each timeframe answers a different question.
The 20-day reading tells me about tactical participation.
The 50-day reading tells me about the intermediate environment.
The 200-day reading tells me whether the larger structure remains healthy underneath the headline indexes.
The readings don’t need to agree all the time. Their disagreement is often the point.
A market can be structurally healthy and tactically weak. It can also enjoy a short-term bounce while the longer-term foundation remains damaged.
The label *bullish* or *bearish* is not enough to describe either one.
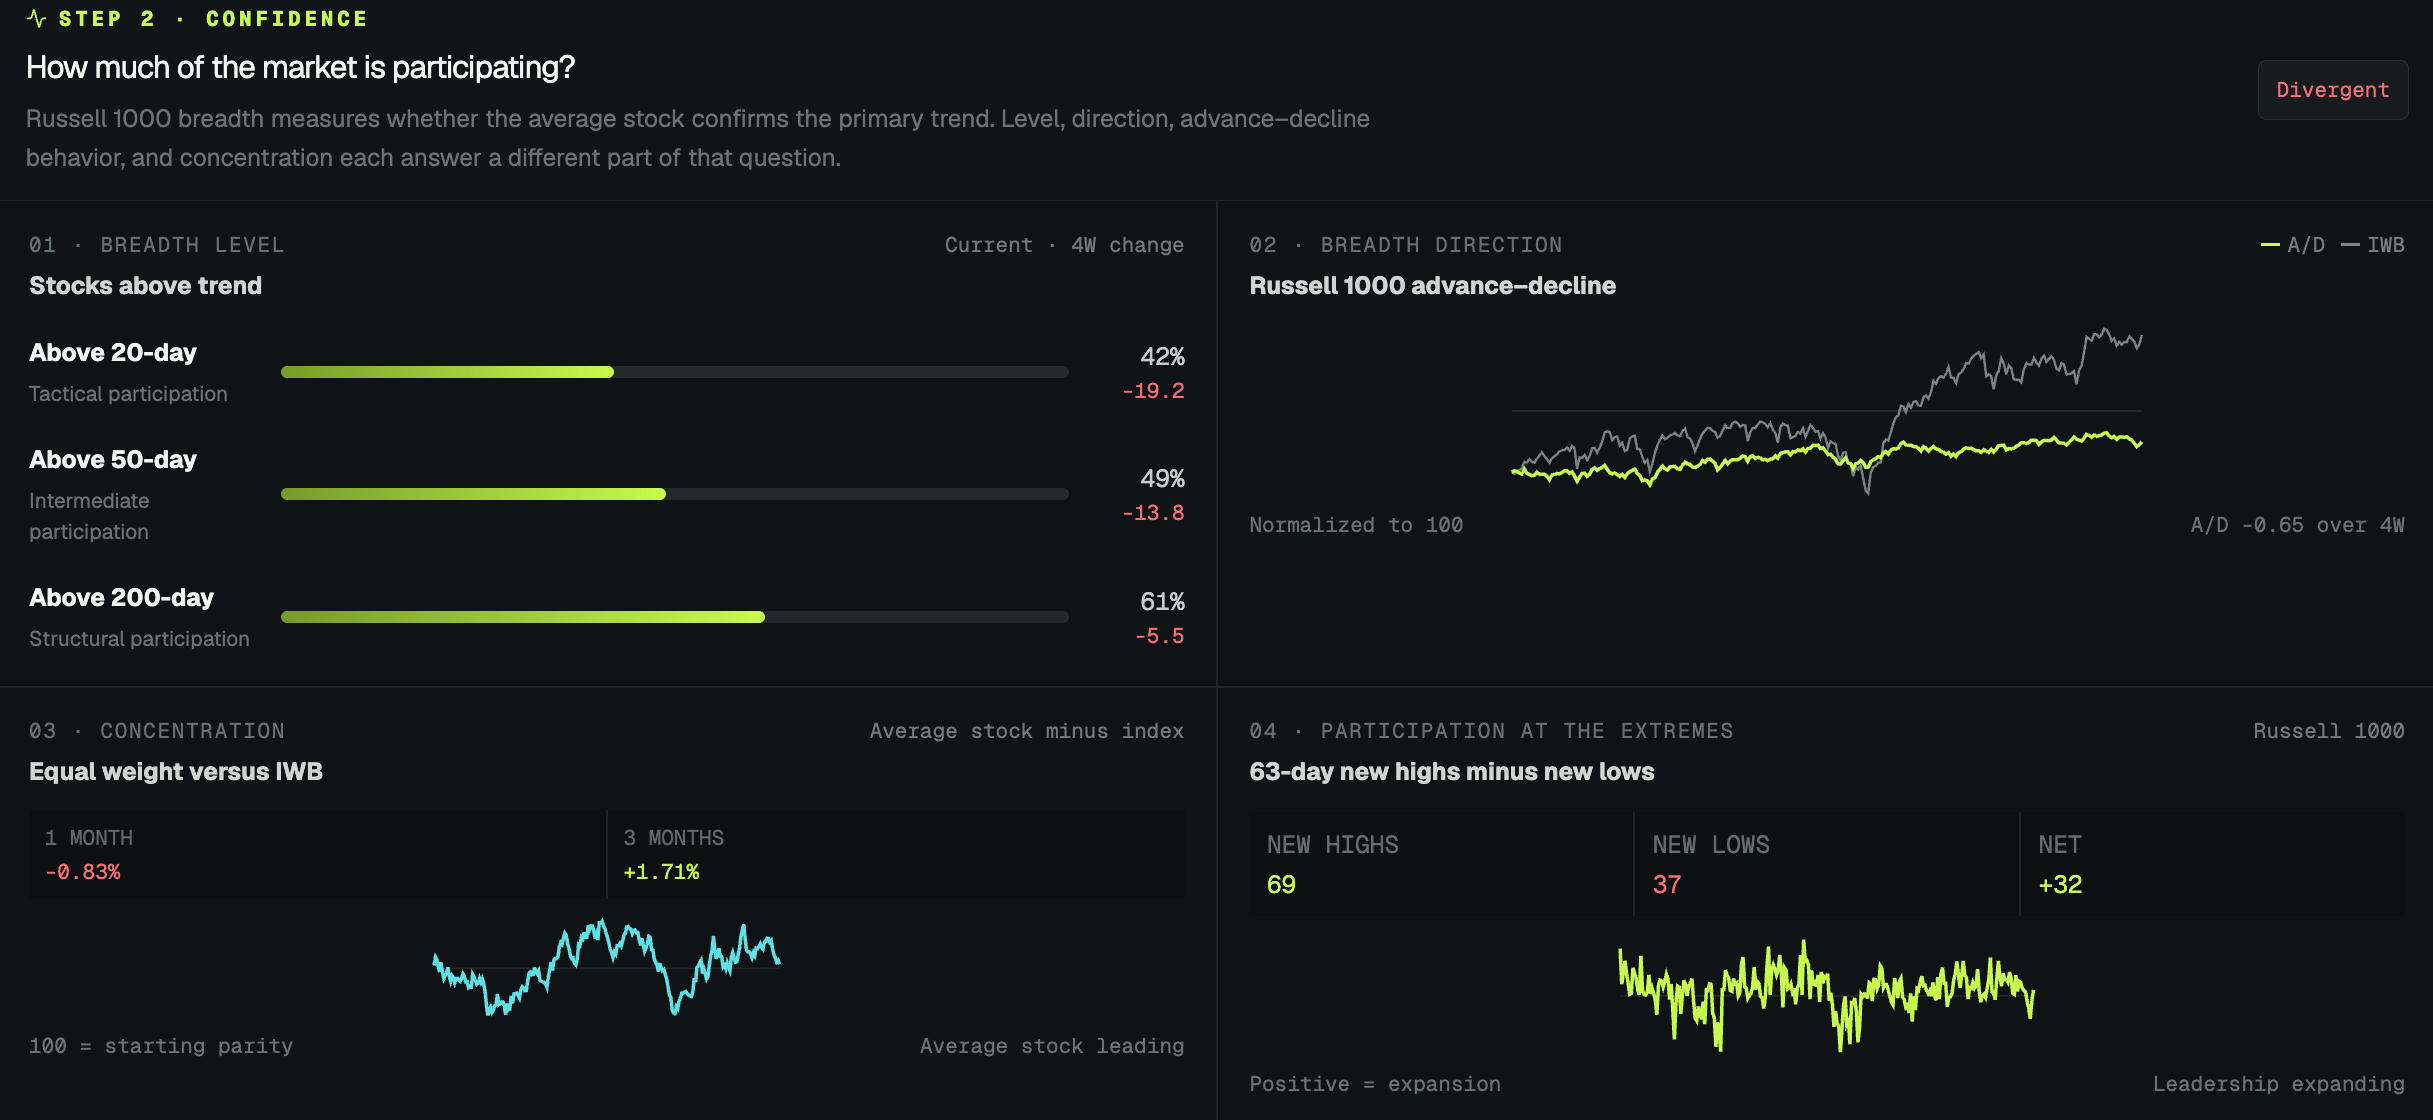
The same market could be structurally healthy and tactically weak. Today, 42% of the 1,012-stock proxy universe was above its 20-day average, 49% was above its 50-day, and 61% was above its 200-day.
Leadership tells me where to fish
Once I understand direction and participation, I want to know where the market is actually rewarding risk.
The market isn’t one trade.
Strength moves through sectors, industries, and individual stocks. Sometimes it broadens across economically sensitive groups. Sometimes it concentrates in a narrow group of defensive companies. Sometimes yesterday’s leaders weaken while an area nobody is talking about begins to improve.
Sector leadership gives me the neighborhood.
Industry leadership tells me which streets deserve attention.
The individual stock still has to prove it belongs there.
This is why I don’t stop with a sector ETF moving higher. One industry can carry an entire sector while the rest of the group goes nowhere. A sector can post a strong return while only a small number of constituents participate.
I want both performance and internal support.
The rotation work compares one week, one month, three months, six months, and year-to-date returns. Breadth adds the percentage of eligible stocks holding their intermediate trends. The industry drilldown then shows where that sector strength is concentrated.
No single horizon owns the answer.
A strong week can be noise. A strong quarter with improving short-term momentum can be the beginning of something more useful. Broad participation strengthens the evidence. Narrow participation asks me to be more selective.
A strong sector doesn’t tell me what to buy.
It tells me where more work may be worth doing.
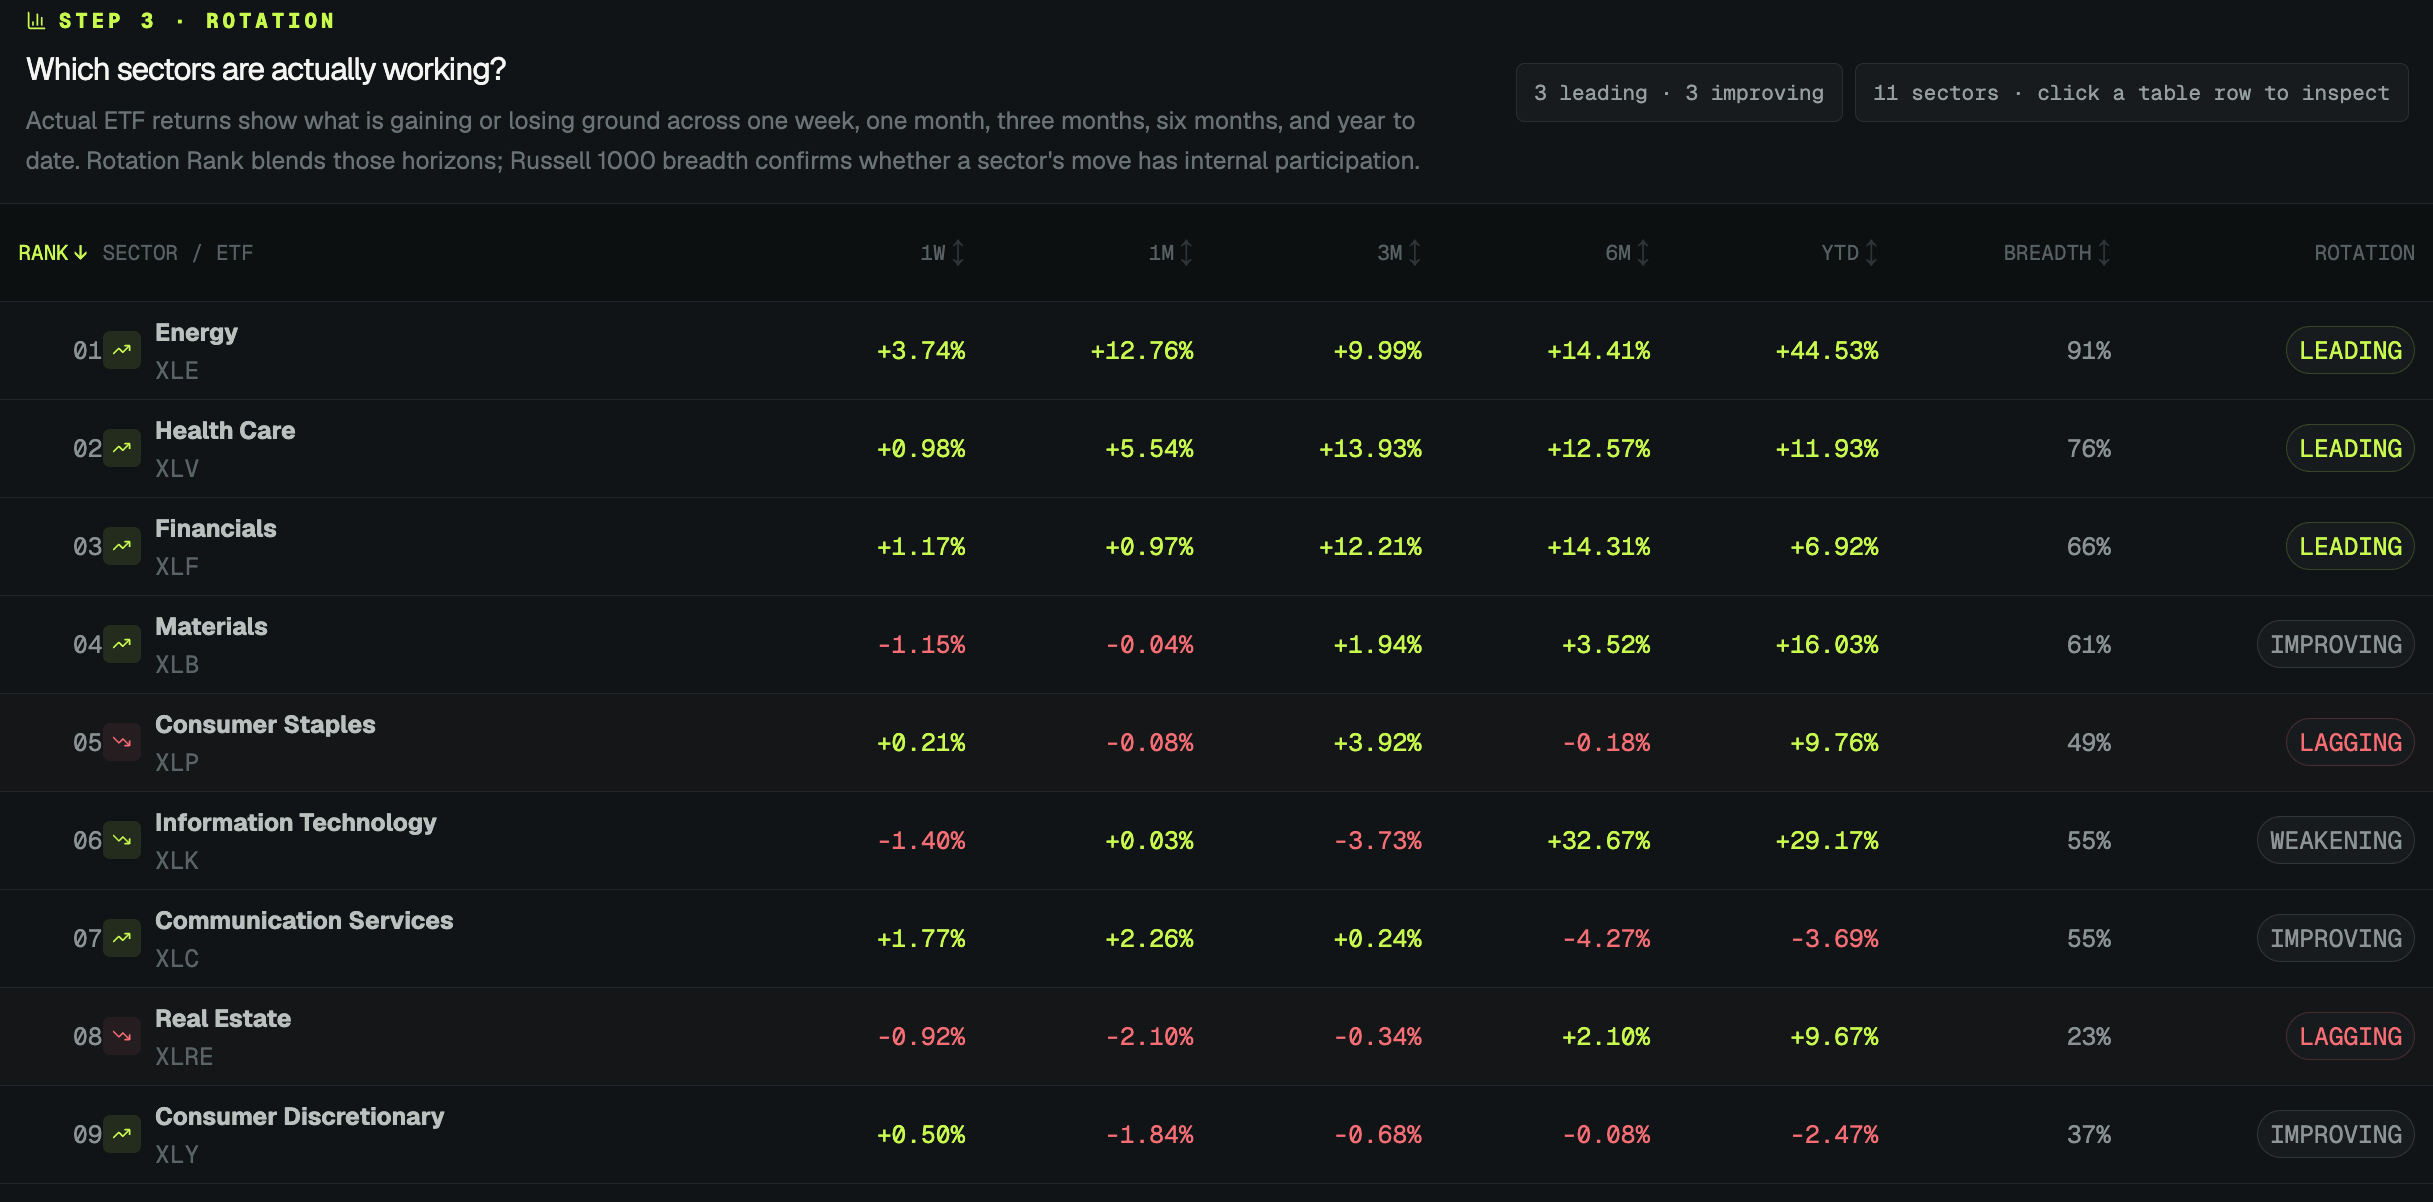
Leadership is not evenly distributed. Energy ranked first in the September 3 rotation work, with 91% of eligible Energy names above their 50-day averages. The industry drilldown then narrowed where the evidence deserved more work.
The environment can help or fight the trend
Price is still the final authority in my process.
But money has a cost, risk has a temperature, and markets don’t operate outside the financial conditions surrounding them.
Volatility changes how easily a position can move against me. Interest rates change the discount applied to future cash flows. The dollar and liquidity influence how supportive the global backdrop is. Growth and inflation pressures change which parts of the market have the wind at their back.
This is where macro analysis is useful.
It’s also where it becomes dangerous.
Give a trader enough economic data and he can build an intelligent-sounding reason to ignore almost any price trend. One rate move becomes the explanation for every stock. One inflation print becomes a complete market thesis. The story becomes more important than what the market is actually doing.
I don’t want macro to replace price.
I want it to tell me whether the environment is helping or fighting the price trend already in front of me.
That distinction matters.
Financial conditions can change how aggressively I participate. They can’t create an entry, and they don’t get to overrule the primary trend by themselves.
In the today’s Market Desk snapshot, the financial backdrop is mixed but improving. Volatility is supportive. Rates and dollar-liquidity conditions are neutral. Growth and inflation pressure remain restrictive.
Again, that isn’t a buy or sell signal.
It’s another reason not to confuse a still-rising primary trend with a frictionless environment.
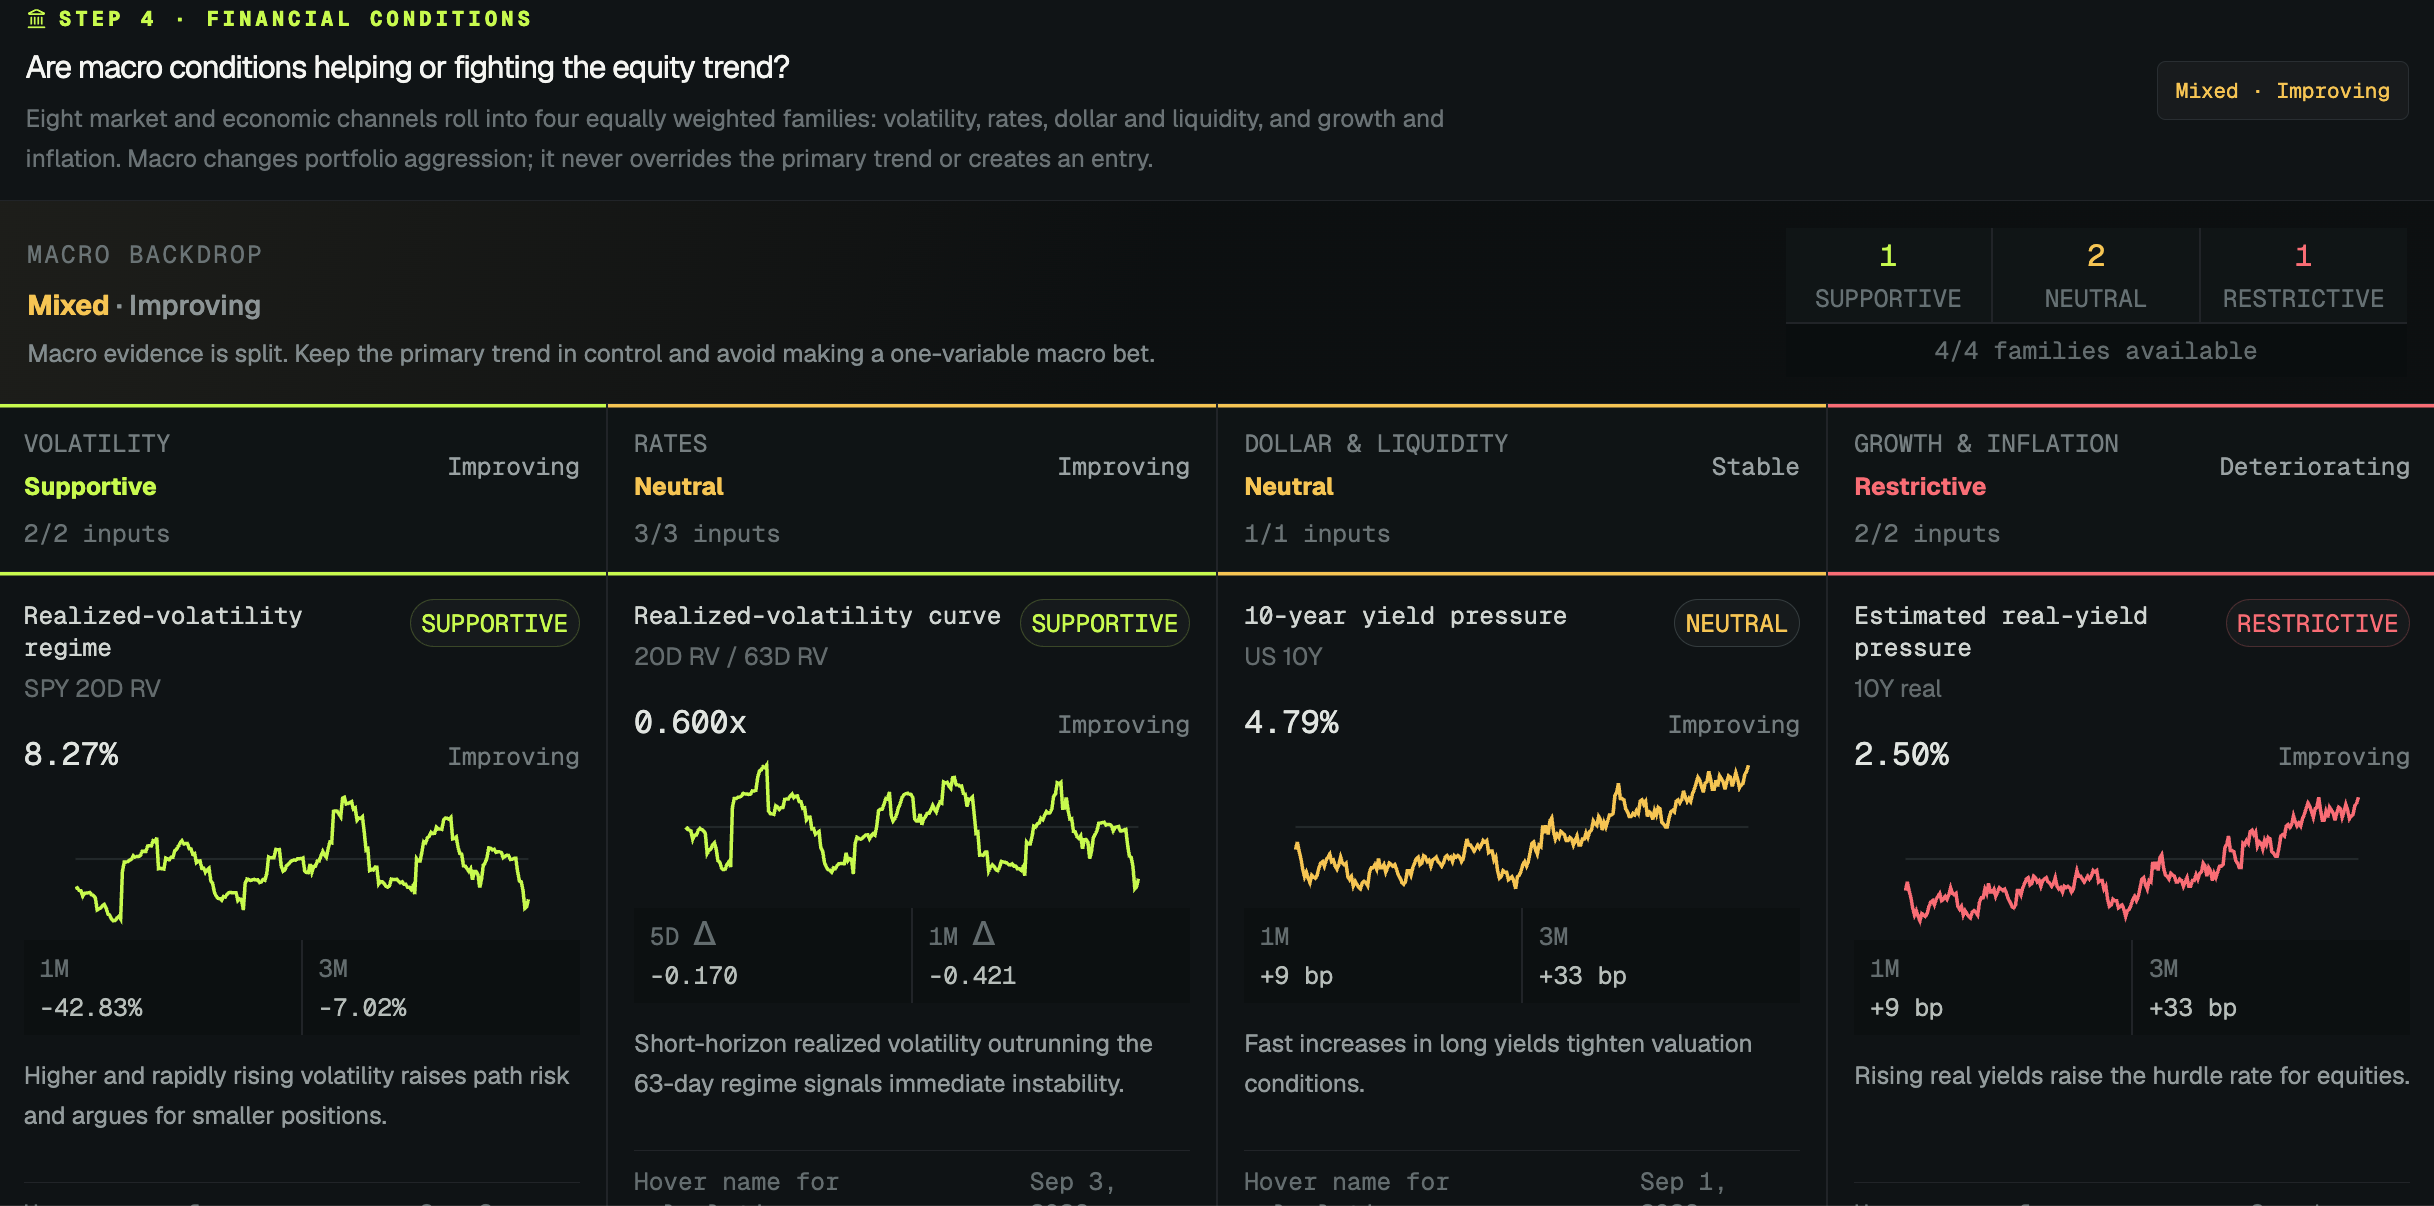
In today’s Market Desk snapshot, financial conditions are mixed but improving: volatility was supportive, rates and dollar-liquidity conditions were neutral, and growth-inflation pressure was restrictive.
The rest of the market gets a vote
Price is the final authority in my process.. but price never exists by itself.
Markets are connected. I think it’s naive to assume stocks live in a vacuum.
Inside the equity market, I compare equal weight with cap weight, small caps with large caps, semiconductors with the Nasdaq-100, cyclical consumer stocks with defensive consumer stocks, and high-beta stocks with low-volatility stocks.
Those are intramarket relationships.
Then I compare the equity story with credit and the broader financial environment.
Those are intermarket relationships.
None of them is a complete answer by itself.
If the headline index is advancing while equal weight, small caps, semiconductors, cyclical demand, and credit confirm it, the story has support from several different parts of the system.
If the index advances while those relationships deteriorate, I don’t need to predict an immediate decline. I need to recognize that fewer parts of the market are carrying the story.
That changes confidence.
It does not create an entry.
This is where traders get into trouble. They turn every relationship into a standalone buy or sell signal. Small caps underperform, so the S&P 500 must crash. Credit behaves well, so every breakout is safe. The dollar rises, so every stock must fall.
That’s not how relationships work.
Their job is to confirm or challenge the primary evidence. They help me understand whether the market is broadening, concentrating, repairing, or quietly weakening.
The more important the decision, the less interested I am in one witness.
I want the weight of the evidence.
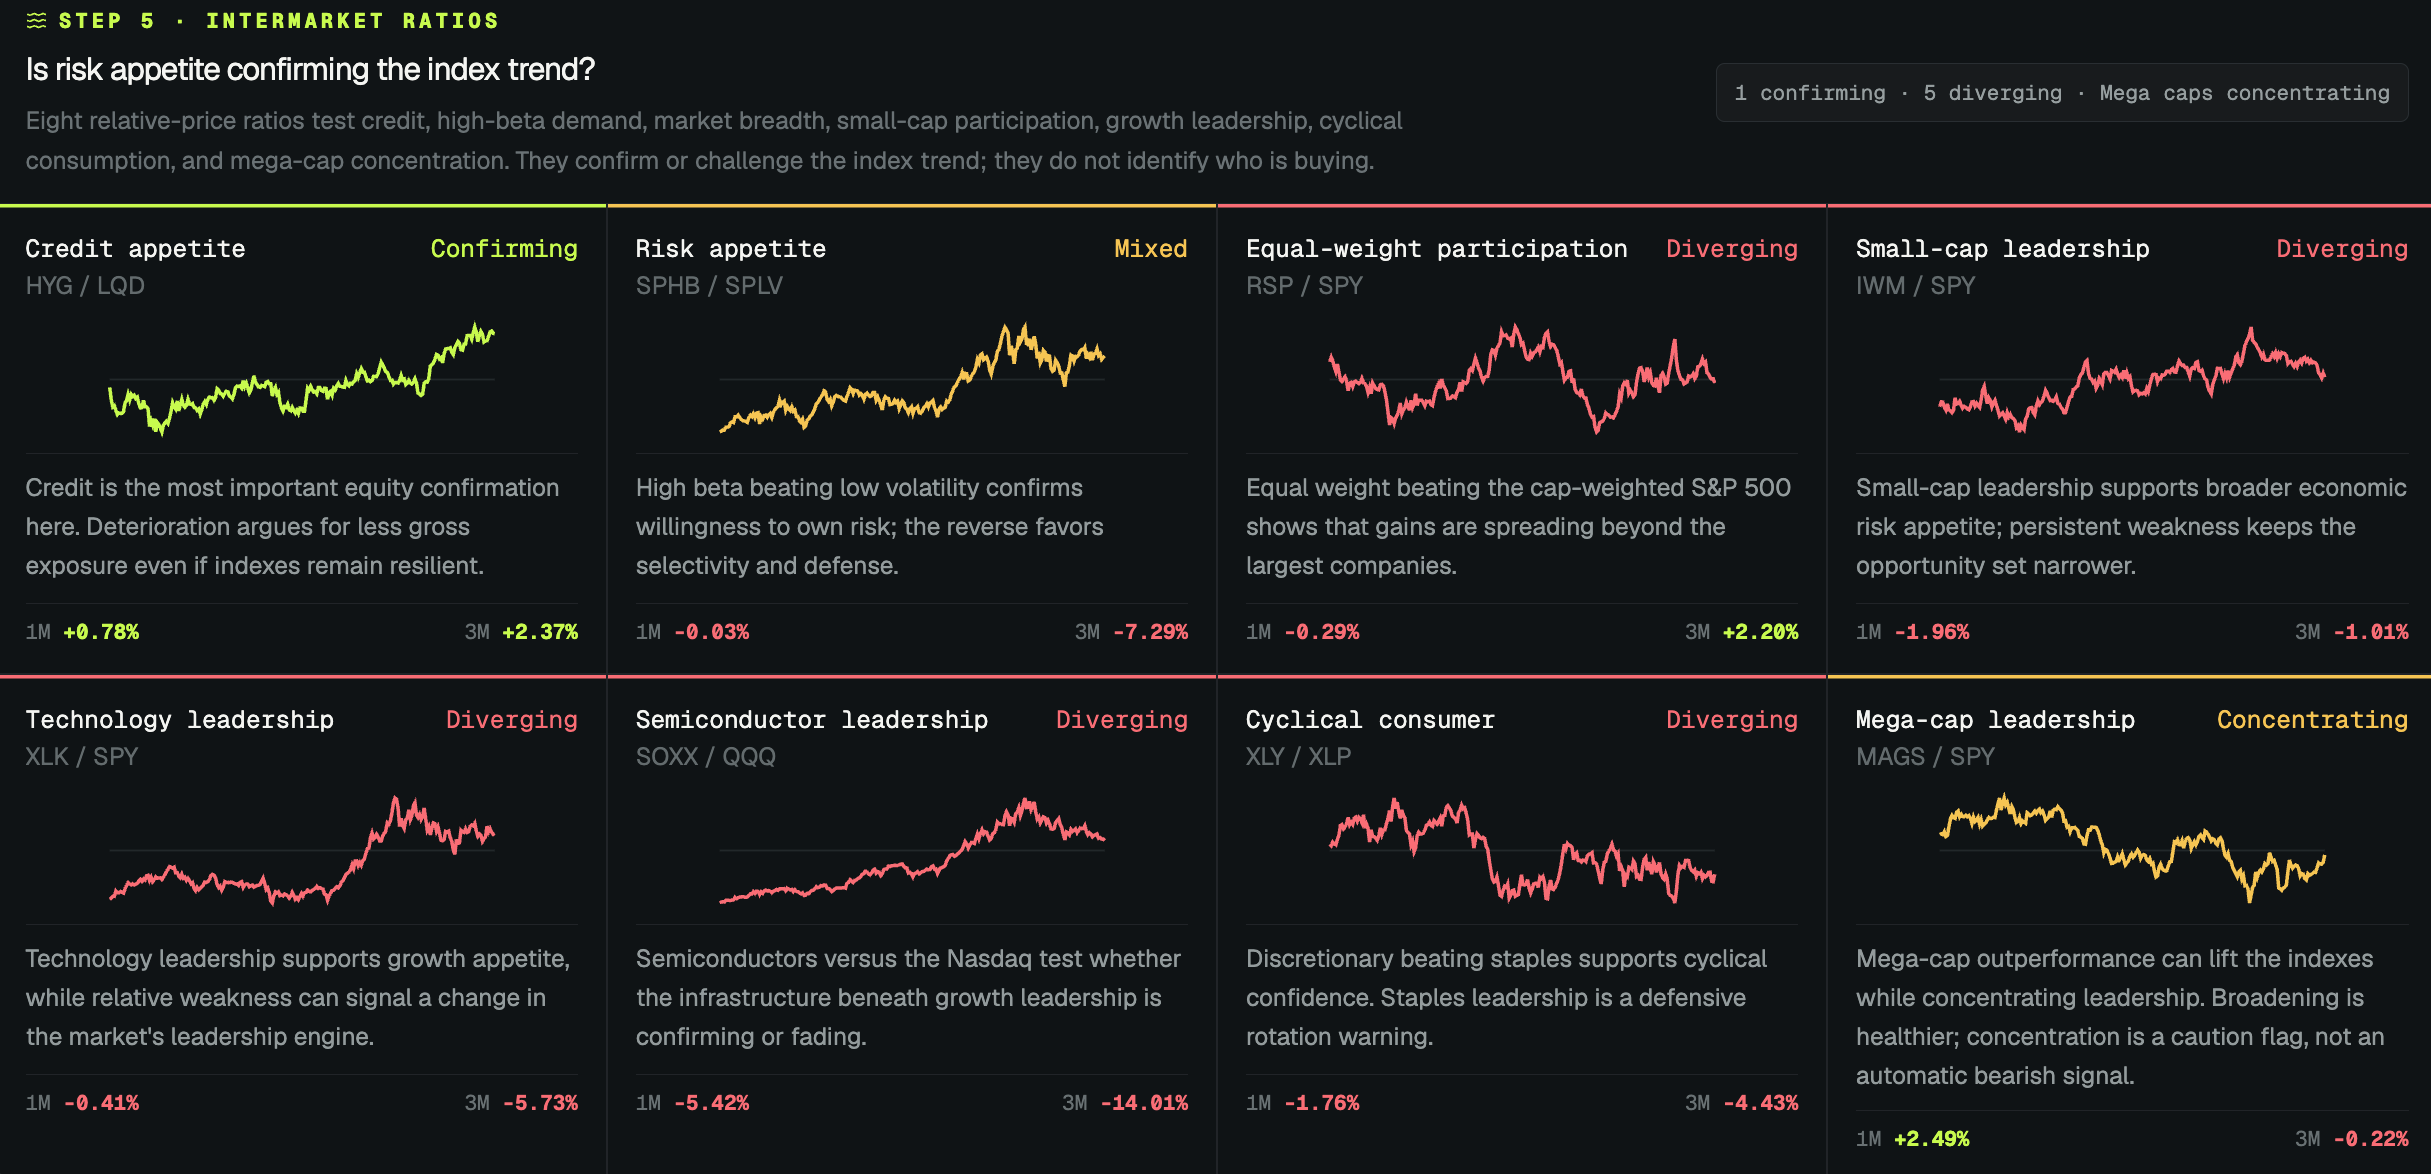
The supporting relationships challenged the headline advance. Credit confirmed, but four important leadership ratios diverged, two remained mixed, and mega-cap leadership was concentrating.
A market can be constructive without earning maximum aggression
Now put the evidence together.
By this point, each layer has done its own job.
The longer-term trend remains higher while much of the supporting cast has entered an intermediate pullback.
Breadth is showing stronger long-term structure than short-term participation.
Leadership is rotating into a smaller number of supported areas.
Financial conditions are mixed.
Several important relationships are refusing to confirm the easy bullish explanation.
There isn’t a contradiction in these conclusions. Different parts of the framework are answering different questions.
If I looked only at the S&P 500, I could argue that everything was fine.
If I looked only at semiconductors or short-term breadth, I could argue that the market was coming apart.
Each view contains some truth. Neither describes the full environment.
The weight of the evidence says the primary trend remains higher, participation has become divergent, leadership has rotated, and the relationships beneath the market are uneven.
That doesn’t require a dramatic prediction.
It requires a practical posture.
Participate selectively.
The direction still deserves the benefit of the doubt. The level of aggression has come down.
Existing winners don’t need to be sold simply because short-term breadth has weakened. New positions do need to bring more evidence. Cleaner triggers matter more. Smaller initial size could make sense. Cash remains available for a better opportunity.
This is where patience stops being passive.
Passing on a mediocre setup is a decision. Waiting for a resumption is a decision. Reducing size when the evidence is less supportive is a decision.
The longer I trade, the more often I say no.
That’s not pessimism.
It’s what a developed process allows you to do.
This is the quieter kind of confidence trading eventually teaches you.
Not, I know what happens next.
I know how I’ll behave across several possible nexts.

The operating conclusion is not an all-in or all-out call. It’s a posture: participate selectively. Market context determined how much aggression the environment has earned; the stock, trigger, invalidation, expression, position size, and management still have to earn the trade.
You have to be able to actually trade this stuff
This is where the boundary matters.
The Market Blueprint is TTI’s included top-down process. It gives us the context we’ve spent this article building.
The Market Desk is part of the included TTI Trade Desk. Its job is to organize that evidence so a self-directed trader can see whether conditions support being more aggressive, selective, defensive, or patient.
It is context.
It is not an entry.
From there, the Hit List, TTI’s included bottom-up process, asks a different question:
Is the stock actually playable?
A leading stock in a strong industry can still be extended. It can lack liquidity. It can have an event sitting directly in front of the trade. It can offer a terrible entry or no clear point where the idea is invalidated.
The stock still needs a trigger.
I need to know where buyers have proved themselves, what price would invalidate the idea, whether I can enter and exit cleanly, and whether the potential reward justifies the risk.
Then I need the correct expression.
Shares may be the cleanest way to participate. Options may add a sleeve of convexity when timing, liquidity, and payoff justify them. Sometimes a smaller position is the right answer. Sometimes the answer is no position at all.
Position size has to be defined from the loss, not from how excited I am about the upside.
And after entry, the position still has to be managed.
A scanner match earns research, not capital. A favorable market posture earns attention, not permission. A strong story doesn’t repair a weak trade plan.
You have to be able to actually trade this stuff.
That’s the part no dashboard can do for you. A screen can organize the evidence. It can’t execute discipline.
Someone can copy every panel on the screen. They still can’t copy judgment.
The durable advantage is the order of the process, the standard applied at each step, and the ability to follow it when real money makes every decision feel different.
It won’t eliminate losses. Nothing will.
What it can do is make the losses easier to understand. It can help separate a valid trade that failed from a poor decision that never deserved the risk. It can keep one outcome from rewriting the entire process.
That’s how confidence is built.
Not by believing every trade will work, but by knowing what you require before you act and what you’ll do if the market disagrees.
The market will remain uncertain. That part is not ours to change.
Our ability to observe, wait, choose, size, and manage can improve for the rest of our careers.
Better judgment can be learned.
Remember: align your trades and portfolio with the direction of the market.
Let the strength of primary trends, breadth, rotation, and more guide your trades to greater and greater profits.
In future letters, we are going to dive deeper into everything mentioned in this letter. Primary trends. Market breadth and confidence. Sector and industry leadership. And more.
If you want to see how the complete process works inside The Trading Initiative, learn more about TTI Membership here.
That’s what I mean when I say the market comes before the stock.
Thank you for reading.
— Hamilton
Read more about how I think about markets after 17-years of staring at charts:
My Trading System: 17-Years and Counting..

What you’re about to read is 17-years worth of trying to figure this whole thing out. What started out as a brain dump ended up being a four hour article. I hope it helps.
Analysis paralysis was big for me. I loved trying out indicators and having 10 of them on my chart. Took a while for me to understand that less is more.