



Prepared for you by Randy Dunham
September 25, 2026
THE PRINT
Midterm years have historically seen a September-October dip before turning higher into year-end.
THE CHART(S) / DATA
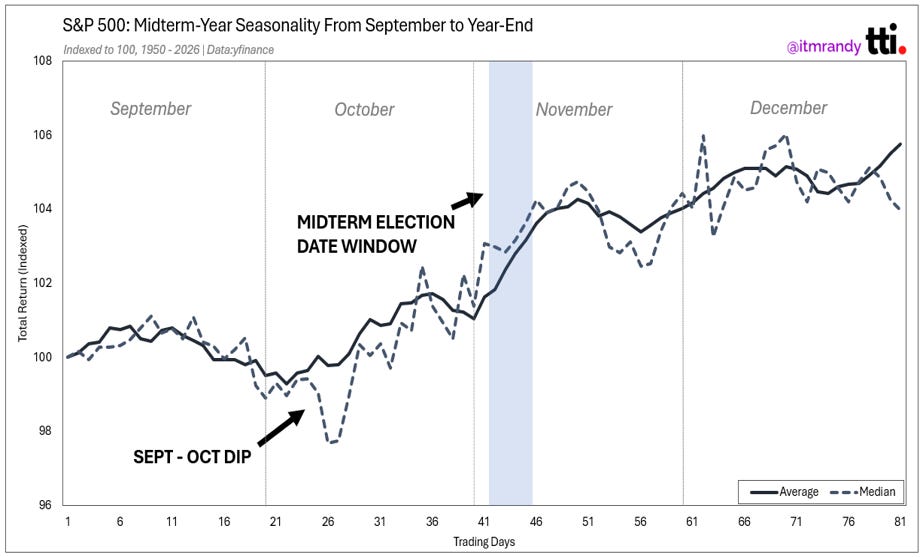
Going back to 1950, the S&P 500 has followed a fairly consistent pattern during midterm years.
The average and median paths tend to weaken from late September into early October. From there, the market has historically moved higher into the elections and through year-end.
This pattern also holds up across both halves of the sample (split 1 = 1950–1986, split 2 = 1990–2022):
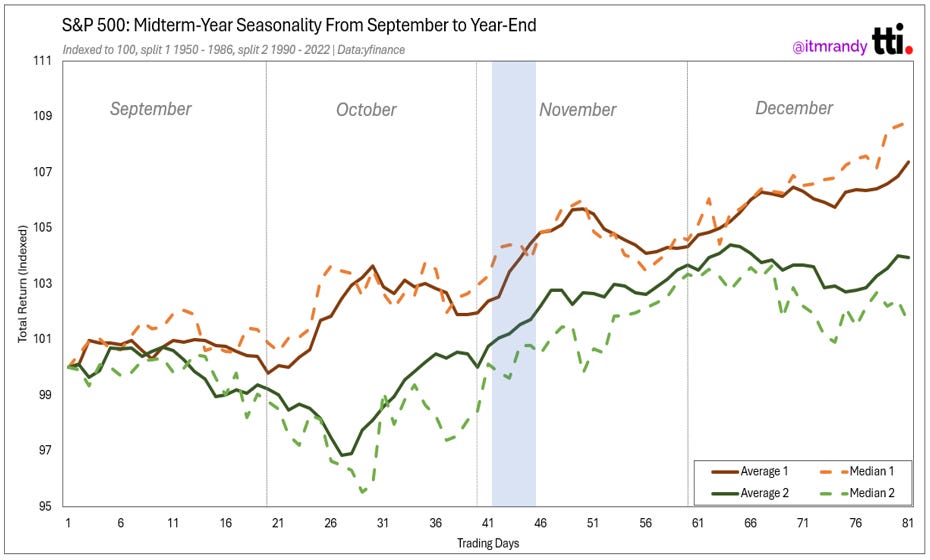
Takeaway: The historical setup points to a period of weakness from late September into early October, followed by a stronger stretch into and after the midterm elections. Keep in mind, midterm elections fall on November 3 this year.
THE TAPE
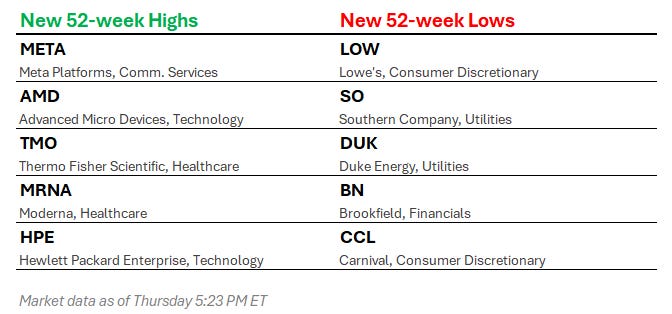
THE HIGHS AND LOWS
SPREAD THE WORD!
CHECK OUT OUR TWITTER AND YOUTUBE TOO!
Material, data, and information in this newsletter are for informational purposes only. This is not tax, legal, or investment advice, and does not constitute a suggestion, solicitation, or offer to buy or sell securities. TTI believes this information is reliable but does not warrant its completeness or accuracy.