



Prepared for you by Randy Dunham
September 23, 2026
THE PRINT
The 100-day relative return spread between semiconductors and the S&P 500 is back to its long-term average.
THE CHART(S) / DATA
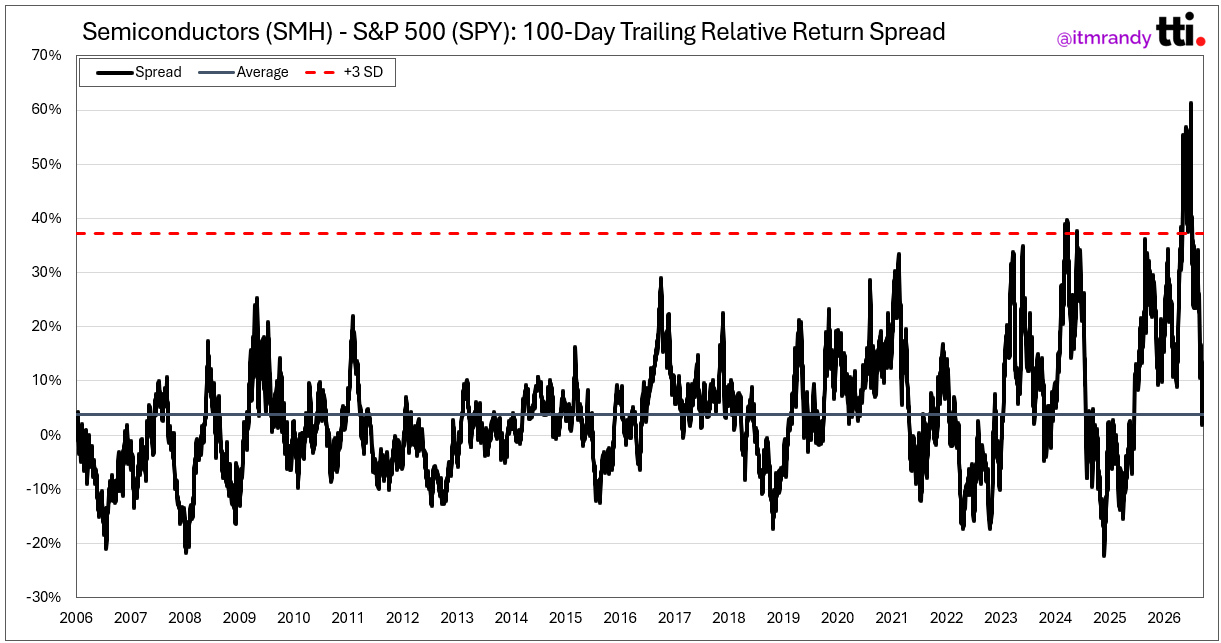
The chart above shows the trailing 100-day relative return spread between semiconductors (SMH) and the S&P 500 (SPY) from 2006 to today.
Three points on this:
Over a 100-day period, semiconductors have historically outperformed the S&P 500 by 3.9% on average.
Since 2006, the spread has reached 3 standard deviations above its average twice (Q2 2024 & Q2 2026).
Over the last 100 days, the spread has fallen back to its long-term average.
This makes the recent strength in the semiconductor ratio look interesting:
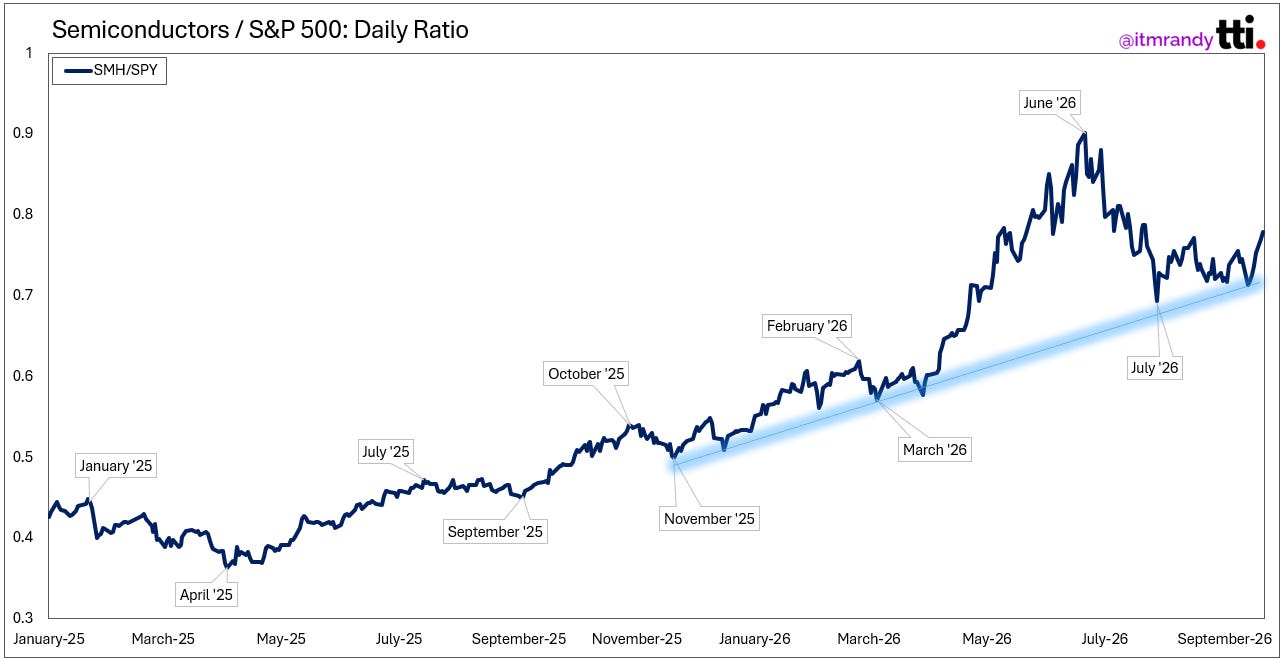
Although the ratio peaked in June, it has since found a local bottom and is now making new 50-day highs.
Takeaway: The recent pullback in semiconductors gave the group a chance to reset. On an intermediate-term time horizon (100 days), the recent outperformance in semiconductors may have more room to run.
THE TAPE
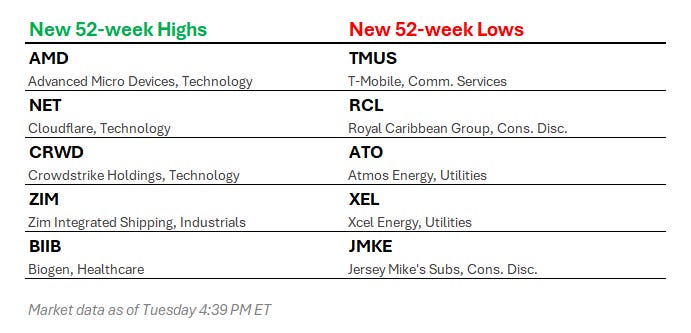
THE HIGHS AND LOWS
SPREAD THE WORD!
CHECK OUT OUR TWITTER AND YOUTUBE TOO!
Material, data, and information in this newsletter are for informational purposes only. This is not tax, legal, or investment advice, and does not constitute a suggestion, solicitation, or offer to buy or sell securities. TTI believes this information is reliable but does not warrant its completeness or accuracy.