


Prepared for you by Randy Dunham
October 16, 2026
THE PRINT
The VIX has spent 81% of the past year below its long-term average.
THE CHART(S) / DATA
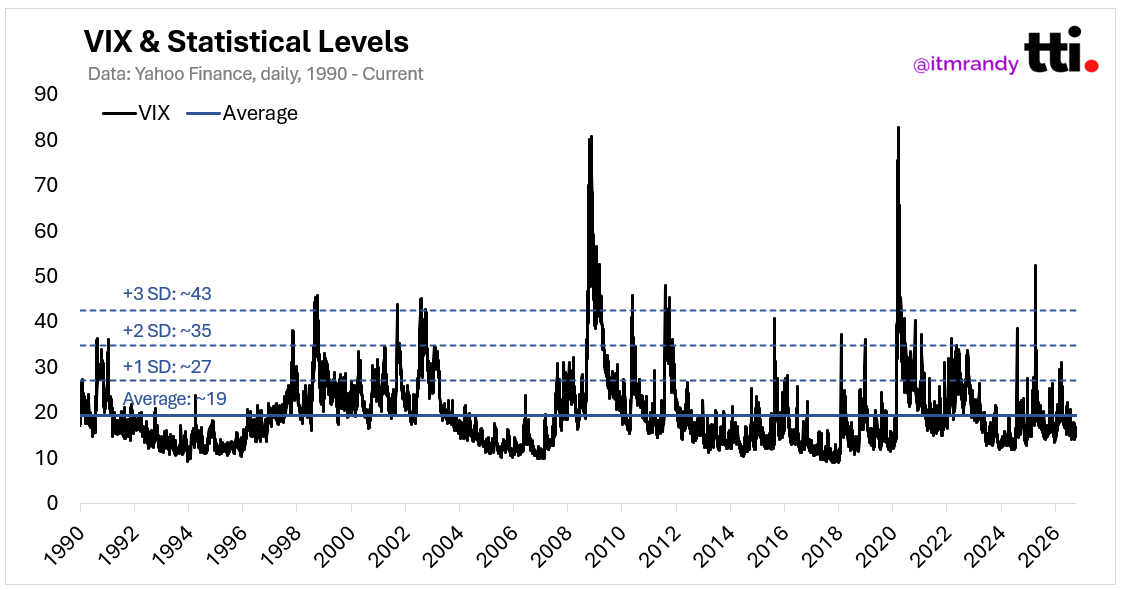
The CBOE VIX Index (also known as the “fear index”) measures market volatility based on S&P 500 options contracts. The VIX was created in 1990 and it’s become a useful tool for evaluating markets.
Here are a few key points worth knowing:
The long run average (1990 - present) of the VIX fluctuates between 19 and 20. The latest reading is 19.4265 to be exact.
The standard deviation around that mean is 8 points.
+1 SD is ~27 to 28.
+2 SD is ~35 to 36.
+3 SD is ~43 to 44.
A high VIX reading (close above 36) is a great long-term signal for buying stocks. It doesn’t have a perfect win-rate. Volatility spikes in bear markets (like 2008), but they work more often than not. Median 6-month gain on S&P 500 is 19% with an 84% win-rate.
A below-average VIX has historically been a favorable backdrop for stocks.
The latest VIX reading came in at 16.45:
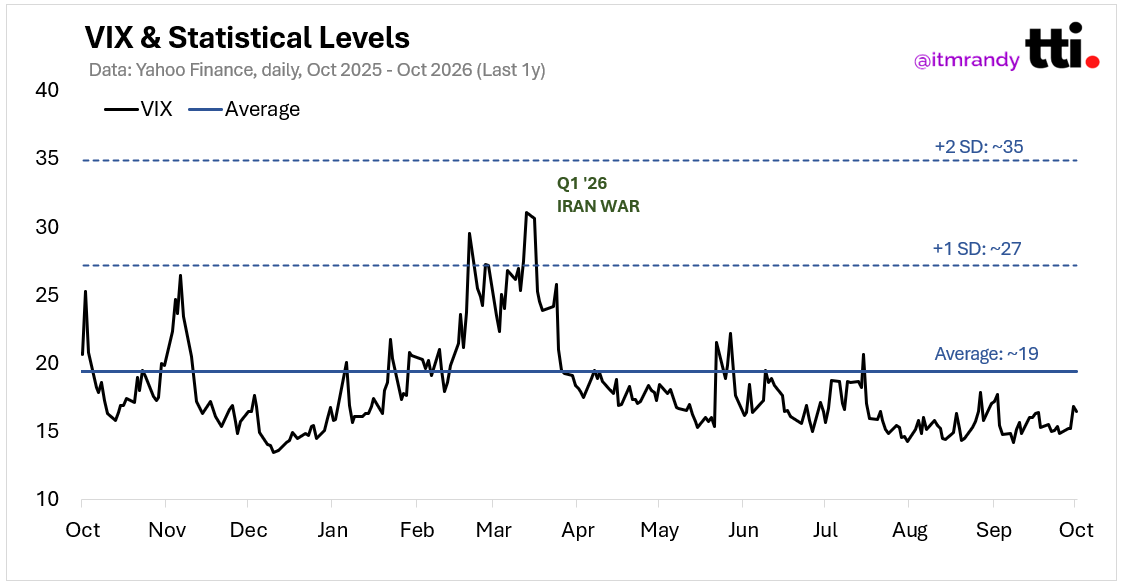
Over the past year, the VIX has traded below 19 for 81% of the time. Its longest stretch above 19 came in Q1, when the Iran war began.
Historically, S&P 500 returns have been stronger when the VIX trades below its long-term average than when it trades between its average and +1 standard deviation:
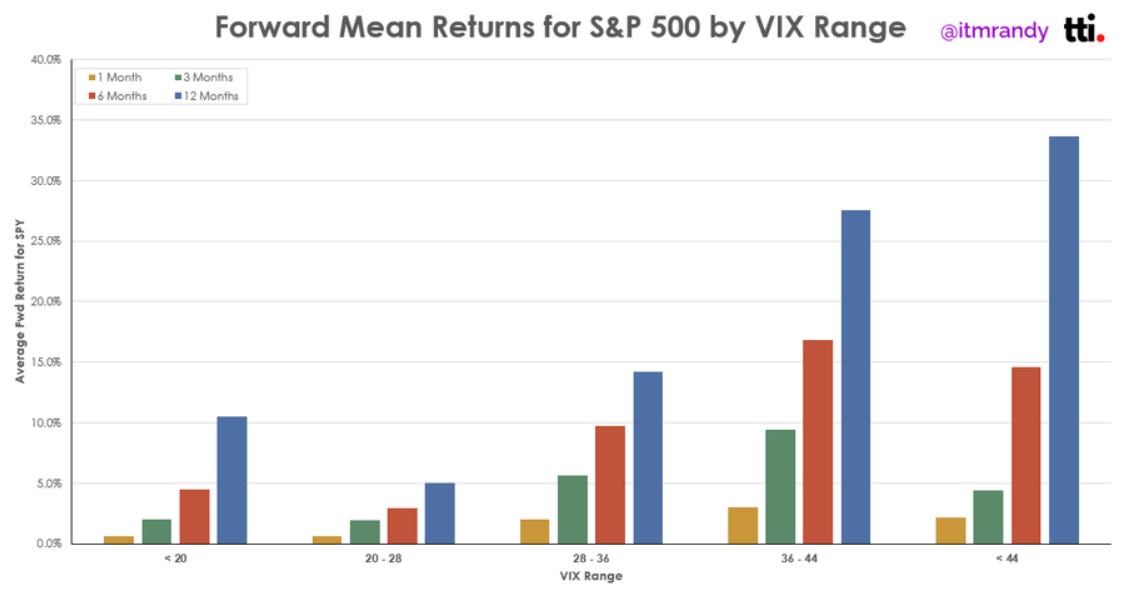
Takeaway: The VIX has spent most of the past year below its long-term average. Historically, that has been a favorable backdrop for stocks.
Comment: Personally, when the VIX is below 20, I view market pullbacks as normal volatility.
THE TAPE
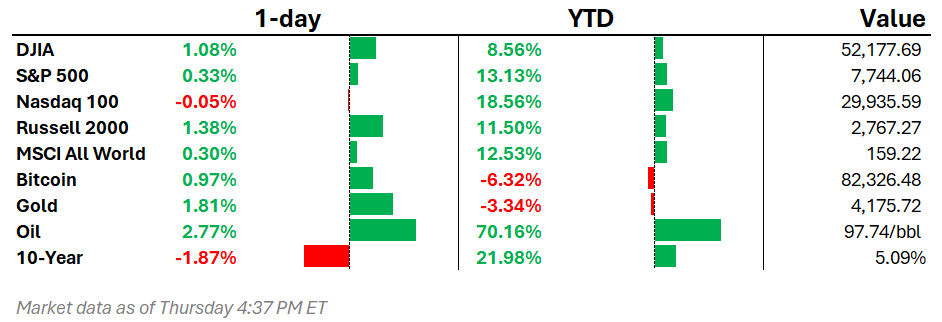
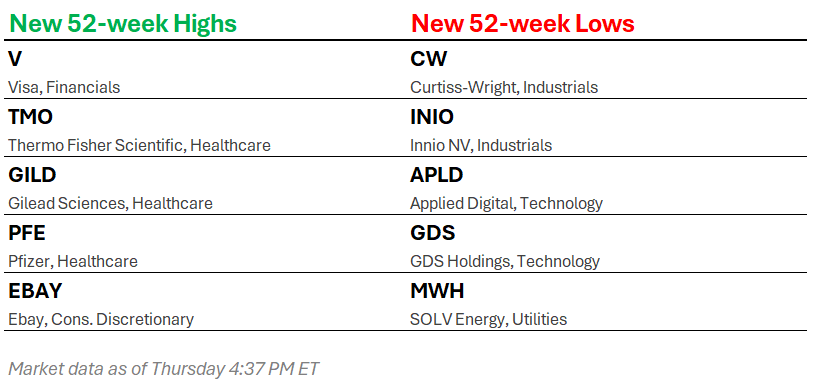
THE HIGHS AND LOWS
SPREAD THE WORD!
CHECK OUT OUR TWITTER AND YOUTUBE TOO!
Material, data, and information in this newsletter are for informational purposes only. This is not tax, legal, or investment advice, and does not constitute a suggestion, solicitation, or offer to buy or sell securities. TTI believes this information is reliable but does not warrant its completeness or accuracy.