



Prepared for you by Randy Dunham
October 12, 2026
THE PRINT
Sharp rises in the MOVE Index have historically been bullish for stocks.
THE CHART(S) / DATA
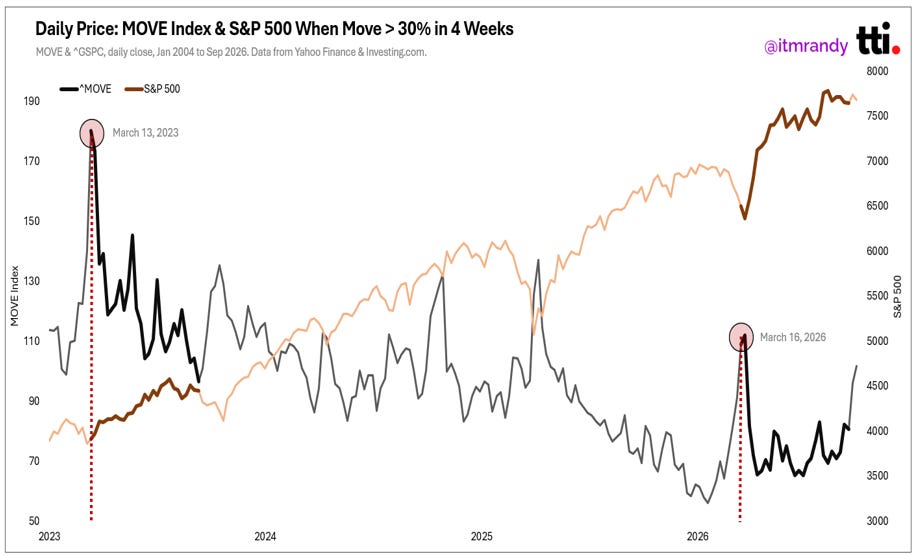
The MOVE Index tracks expected volatility in the U.S. Treasury market. In simple terms, it measures how much uncertainty there is around interest rates.
The chart above highlights instances where the MOVE Index’s 4-week rate of change rose above 30%.
Two points on this:
The MOVE Index saw its first notable decline last week after a sharp rise.
Both prior signals were followed by a swift decrease in the MOVE index and strong gains for the S&P 500.
The median and average following a MOVE spike of this degree were above typical returns 13 to 26 weeks out:
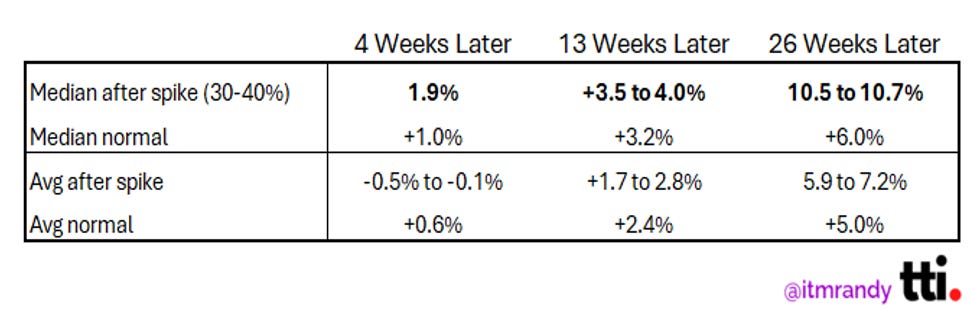
Takeaway: Sharp rises in rate volatility have historically been a bullish signal for stocks. The recent pullback in the MOVE Index could be a sign that some of that uncertainty is starting to fade.
THE TAPE
THE HIGHS AND LOWS
SPREAD THE WORD!
CHECK OUT OUR TWITTER AND YOUTUBE TOO!
Material, data, and information in this newsletter are for informational purposes only. This is not tax, legal, or investment advice, and does not constitute a suggestion, solicitation, or offer to buy or sell securities. TTI believes this information is reliable but does not warrant its completeness or accuracy.