



Prepared for you by Randy Dunham
October 1, 2026
THE PRINT
Credit spreads hit new 100-day highs and moved back above their 50-day moving average.
THE CHART(S) / DATA
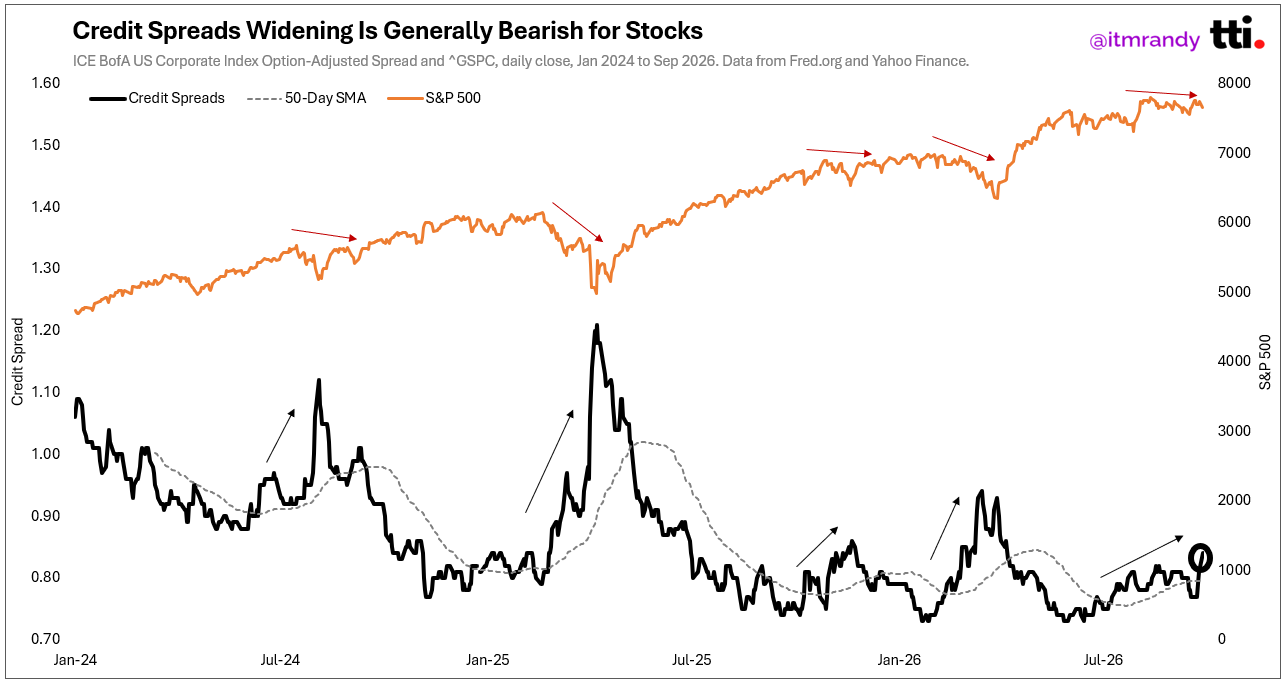
Credit spreads measure the extra yield investors demand to hold investment-grade corporate bonds instead of U.S. Treasuries.
Example:
If a U.S. Treasury yields 4.0% and a corporate bond yields 5.5%, the credit spread is 1.5%. That difference is the extra yield investors demand for taking on additional risk.
U.S. Treasuries are backed by the federal government and are viewed as very low risk. Corporate bonds carry more risk because companies are more likely to default on their debt.
When spreads widen (go up), investors demand more compensation to hold corporate bonds. This could reflect concerns about companies' ability to repay debt, the economy, or broader financial stress.
When spreads tighten (go down), investors are willing to accept less extra yield to hold corporate bonds. This often reflects greater confidence in companies and the economy.
A simple way to track the trend is to compare credit spreads with their 50-day moving average. When spreads are widening, stocks have often seen more volatility and choppy price action.
Takeaway: Credit spreads help you understand how bond investors are pricing corporate credit risk. Right now, credit spreads have hit a new 100-day high and moved back above their 50-day moving average. Over the past couple of years, this simple filter has often preceded periods of market volatility.
THE TAPE
THE HIGHS AND LOWS
SPREAD THE WORD!
CHECK OUT OUR TWITTER AND YOUTUBE TOO!
Material, data, and information in this newsletter are for informational purposes only. This is not tax, legal, or investment advice, and does not constitute a suggestion, solicitation, or offer to buy or sell securities. TTI believes this information is reliable but does not warrant its completeness or accuracy.