


Retail is one of this quarter’s strongest industries
TGT is building a multi-year base inside that leadership
The early setup offers dramatically better risk/reward than chasing the breakout
Most traders hear “10:1 reward-to-risk” and assume somebody is either exaggerating or got lucky.
I look at it differently.
Those opportunities exist, but they usually don’t look obvious yet.
The trick is identifying the larger opportunity early enough that your invalidation is still close and the potential upside is still large.
Target is giving us a great live example.
Start With Where the Money Is Going
I don’t start by randomly flipping through stock charts.
First, I want to know where I should be hunting.
Our Market Blueprint framework does that job.
Right now, retail is one of the strongest areas of the market. Quarter-to-date, XRT is the second-best-performing industry ETF in the group I track, up 6.56%.
That matters.
Strong stocks tend to come from strong groups.
And when an industry is outperforming while other parts of the market are struggling, that tells me capital is choosing it.
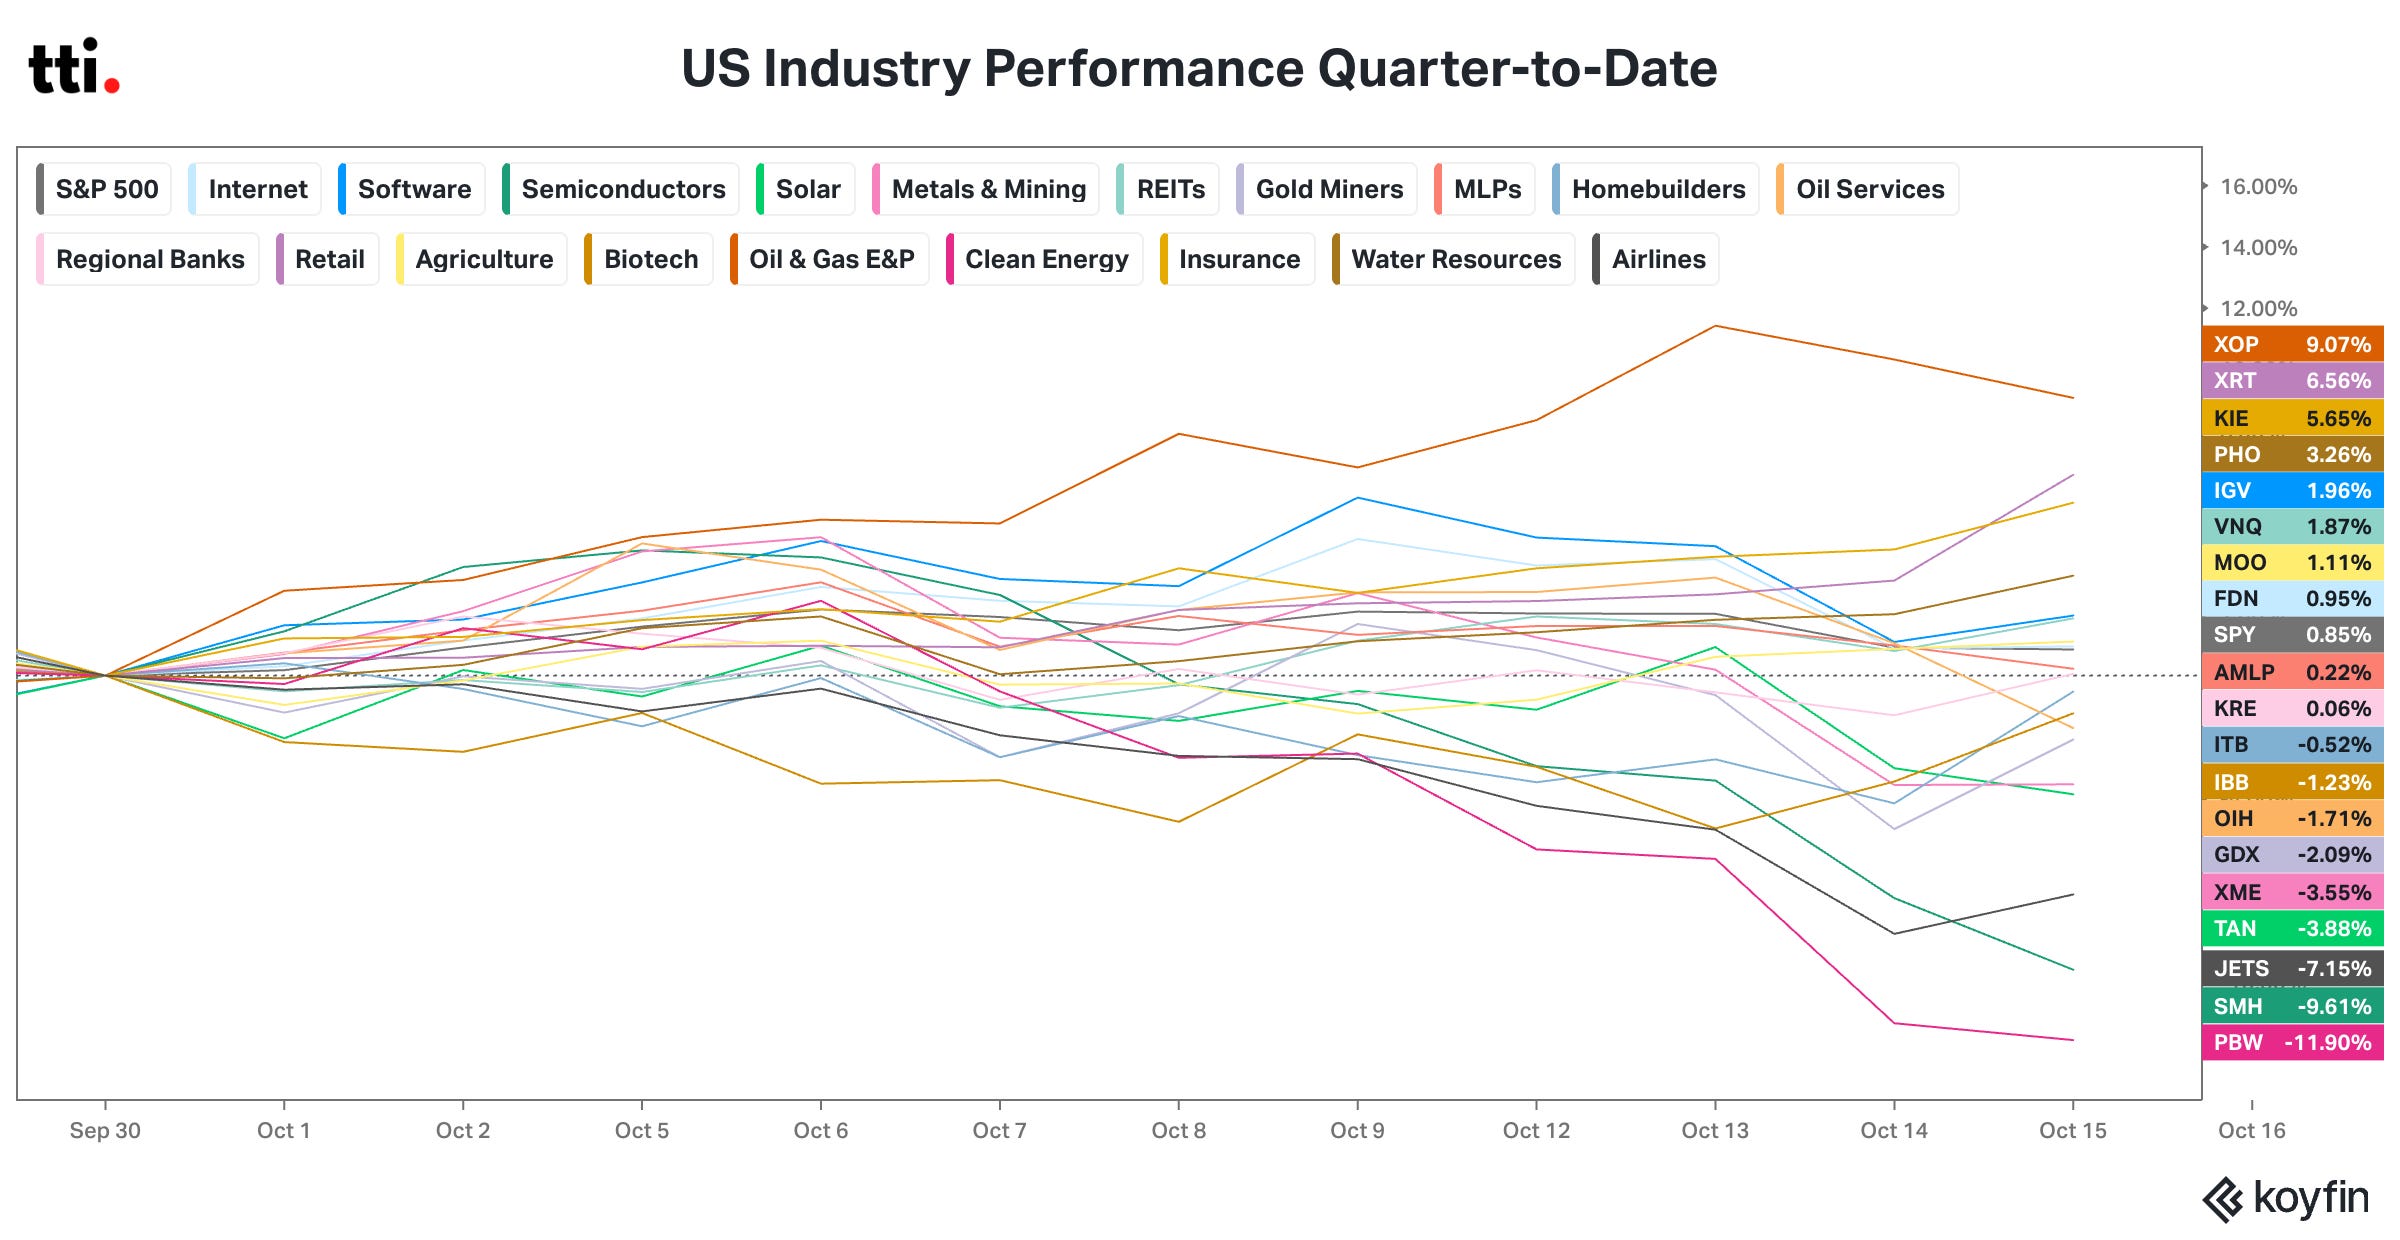
That doesn’t automatically make Target a buy.. it tells me where to look.
The next question is:
Which stocks inside that area have the structure to produce an asymmetric trade?
That’s where TGT gets interesting.
The Big Setup Is Hiding in Plain Sight
Zoom out.
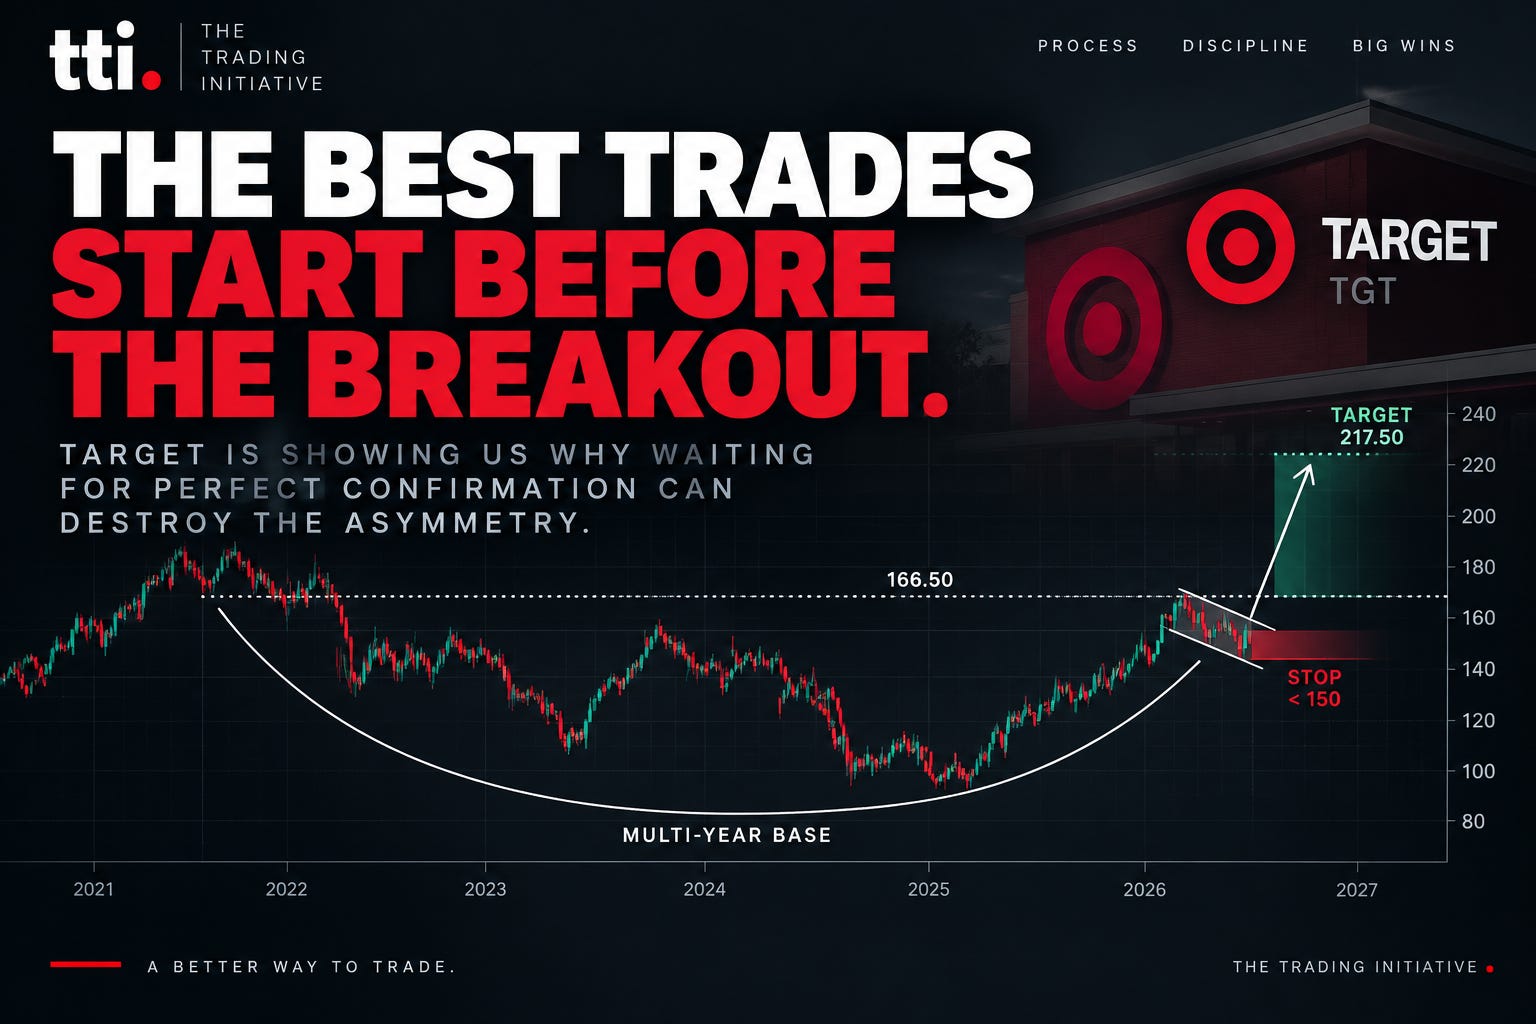
Target has spent years building what looks like a massive cup-shaped base.
The major resistance level is around $166.50.
That is the obvious breakout.
If TGT clears that level, every 52-week-high scanner in the world is eventually going to see it.
But look closer.
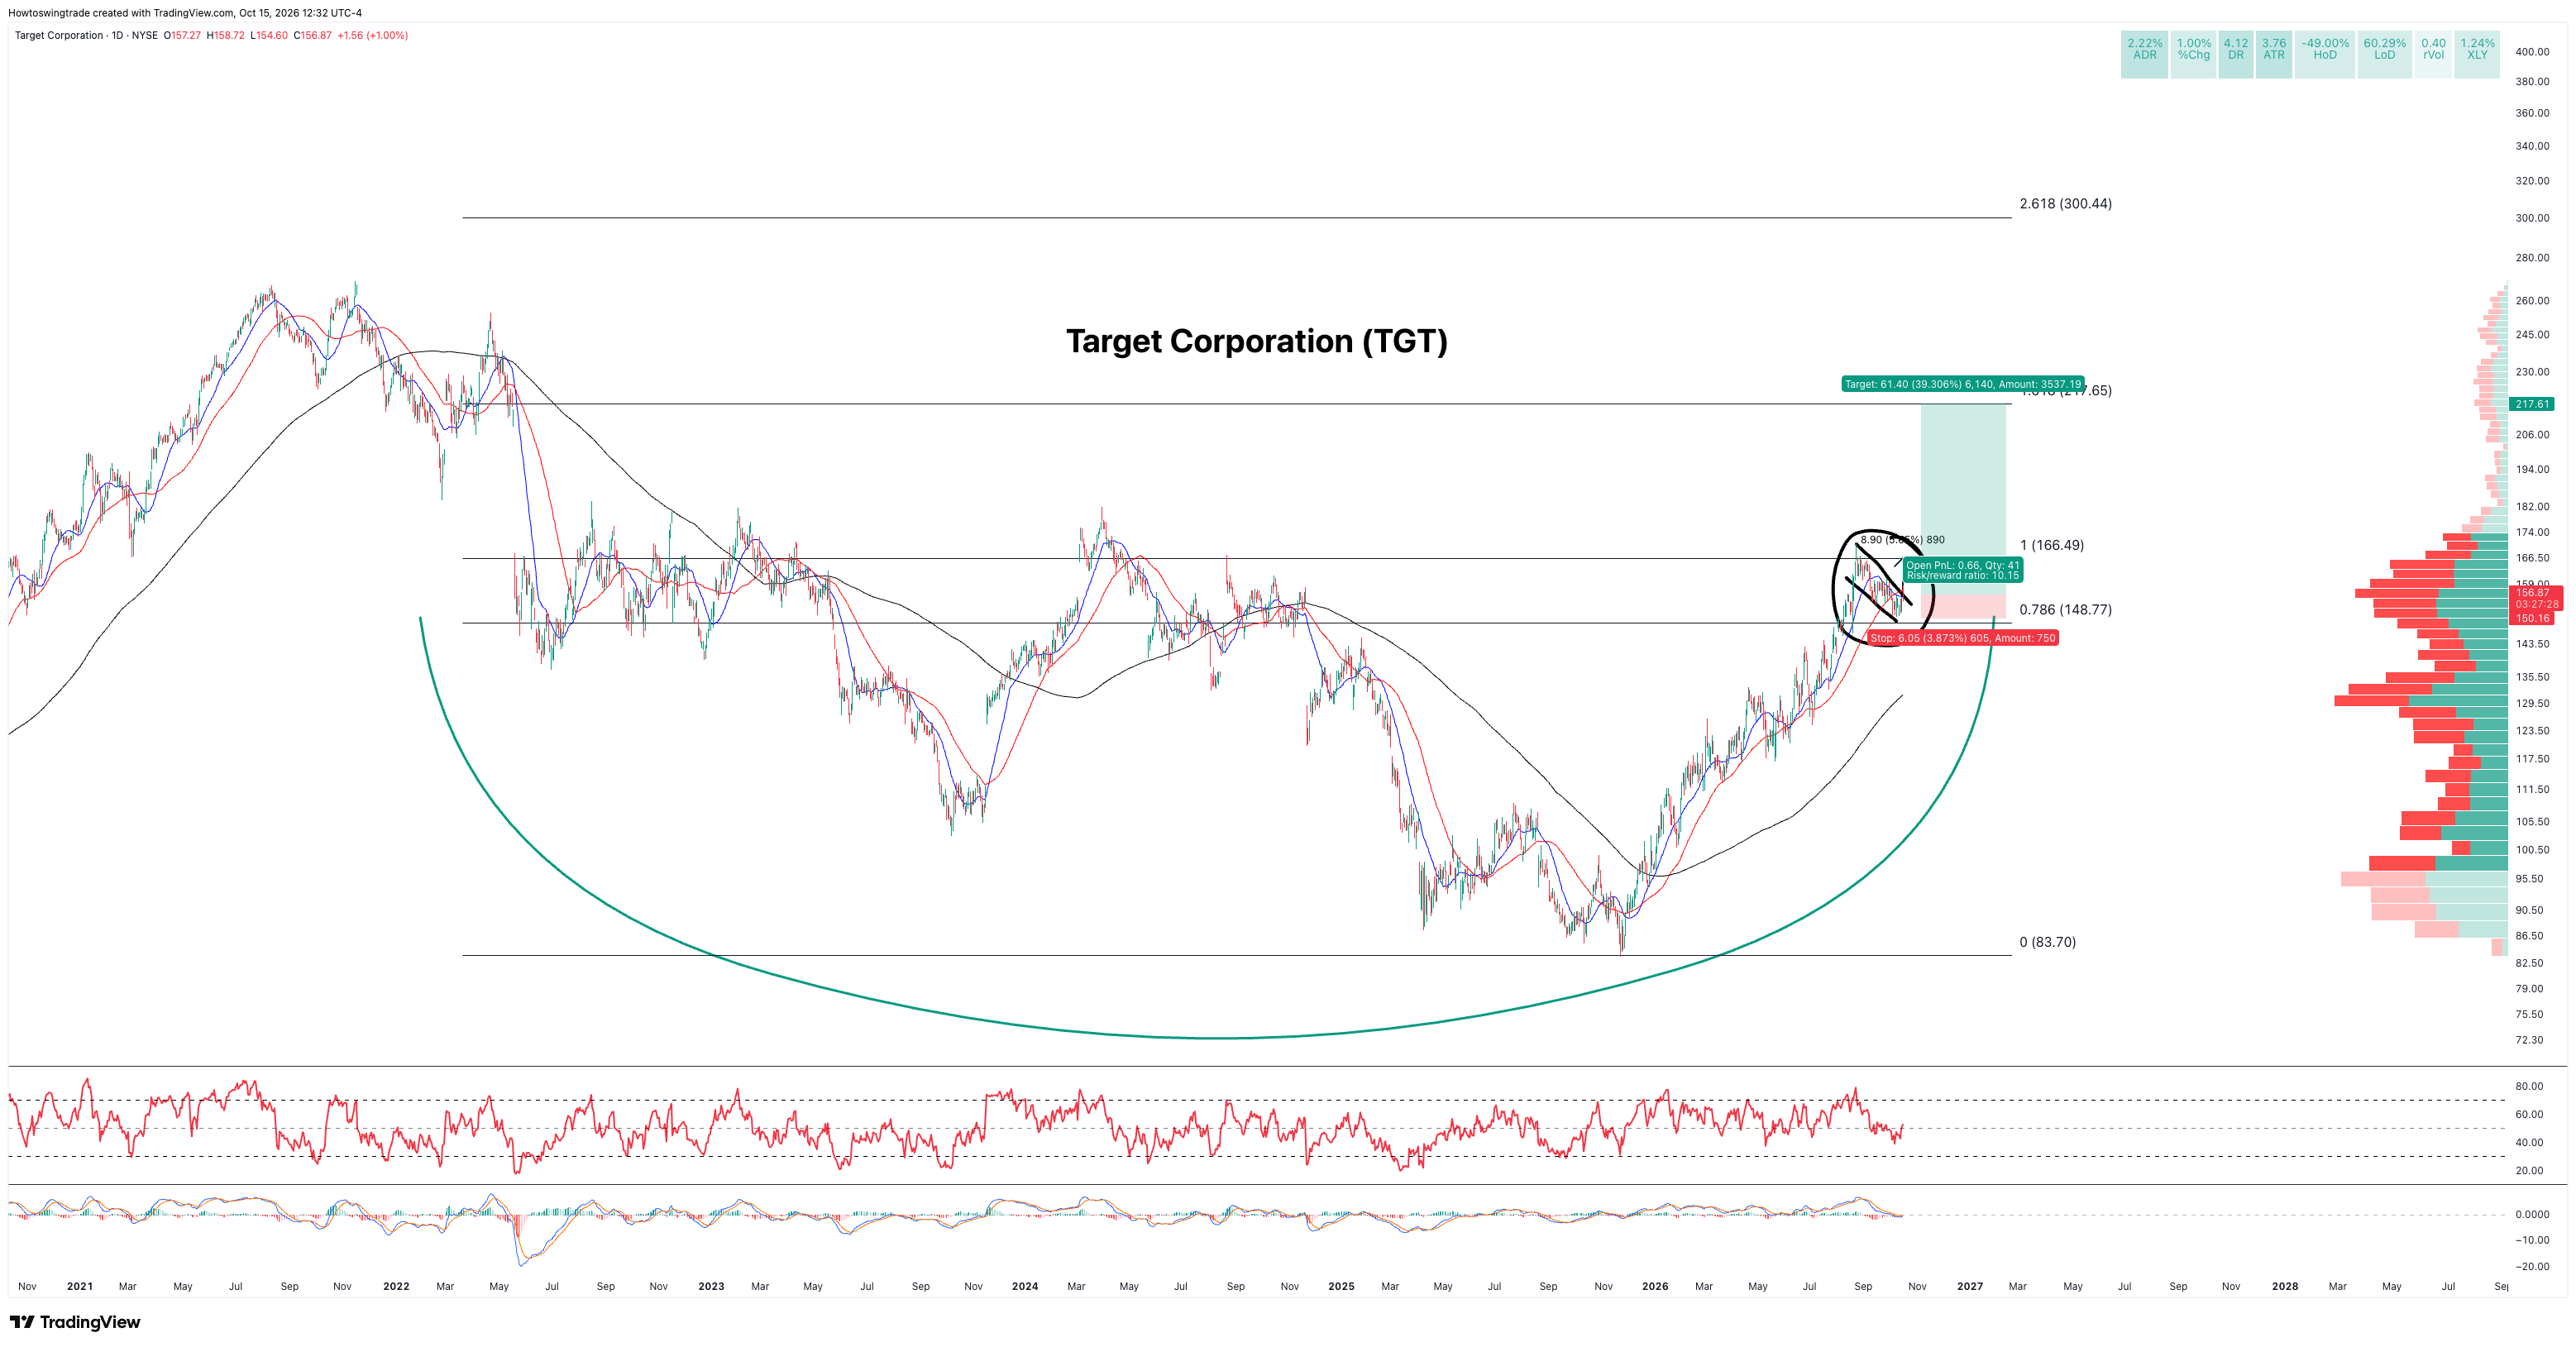
Inside that giant base, price is consolidating in a small descending channel.
In plain English:
The stock had a strong run, stopped going straight up, and has been drifting lower in a controlled way.
That smaller pattern is essentially a bull flag inside the much larger base.
This is where timing becomes important.
If we wait until TGT breaks $166.50, we may get more confirmation.
But we also pay for that confirmation.
The entry gets higher. The stop gets farther away. And the reward-to-risk becomes worse.
The smaller pattern may give us a chance to get involved before the obvious breakout.
Want more setups like this in your inbox?
This Is Where the 10:1 Comes From
Here’s the setup I’m working with.
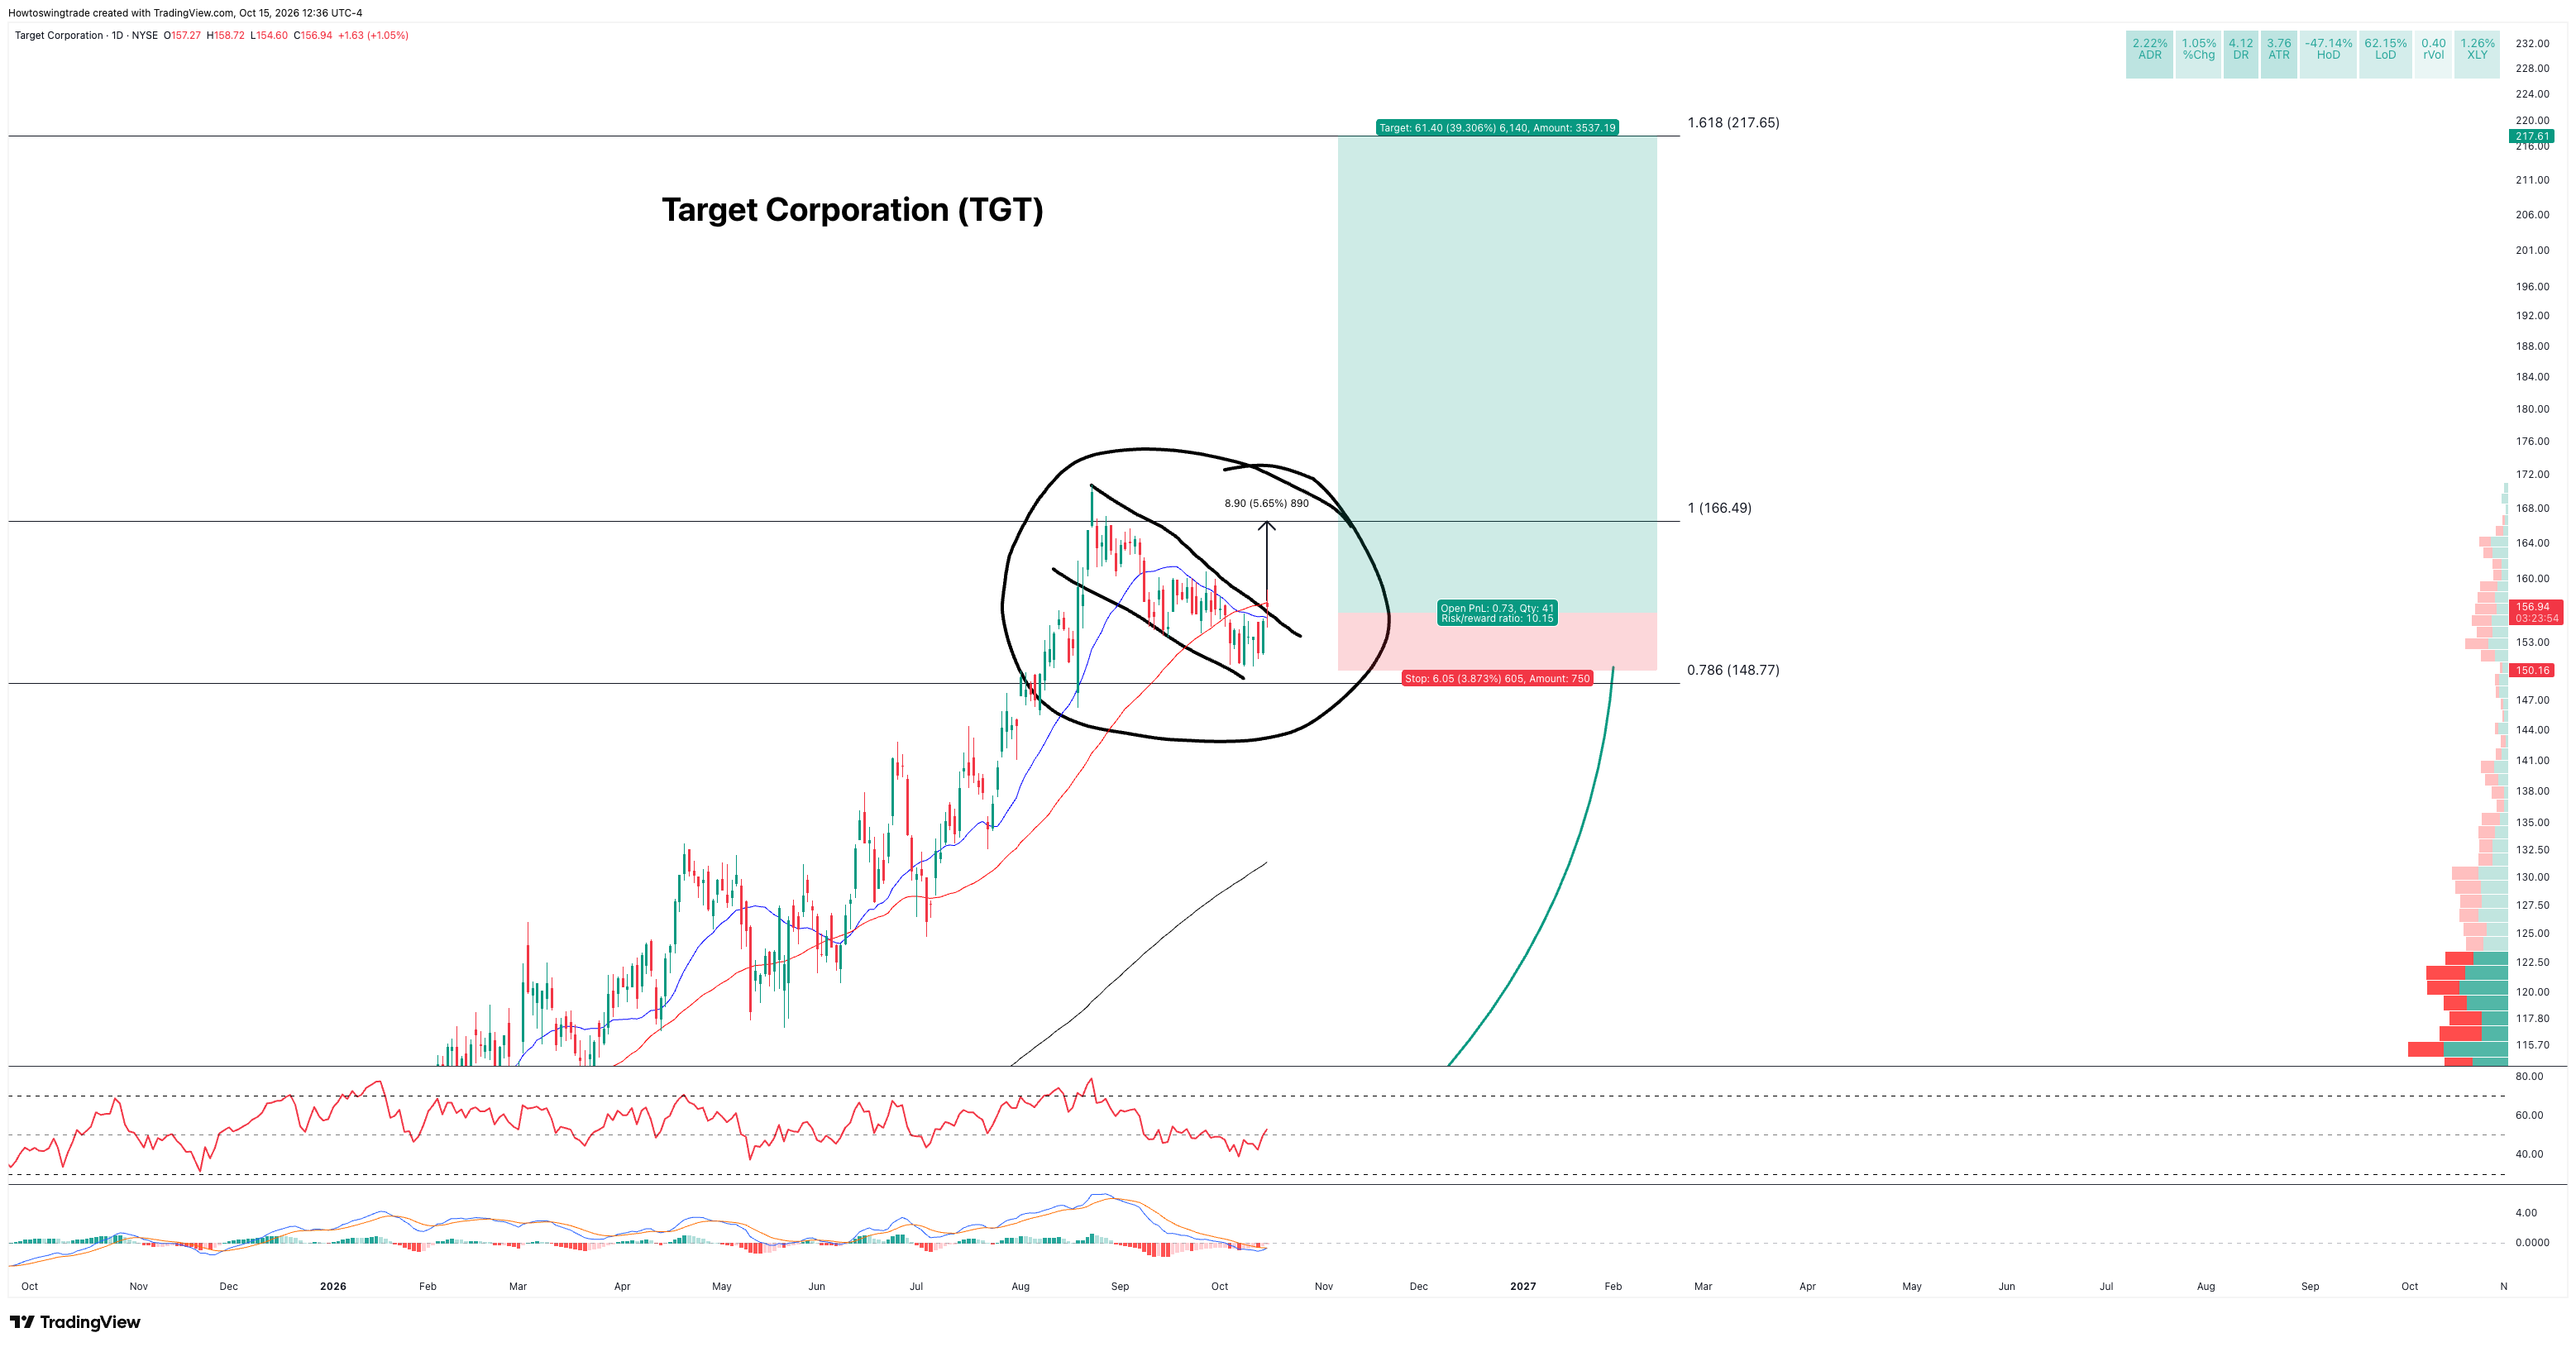
TGT is currently around the mid-$150s.
The bottom of the structure gives us an invalidation near $150.
And the upside reference I’m watching sits around $217.50, near the large open gap from 2022.
Using the trade structure on my chart, the potential reward is roughly 10 times the amount being risked.
That doesn’t mean TGT is guaranteed to reach $217.50.
It absolutely isn’t.
The important point is the asymmetry.
If the flag breaks and the setup works, there is a lot of room above us.
If it fails, I already know approximately where the thesis is wrong.
That’s what I want.
Defined downside. Large potential upside.
And notice why we get that math.
It isn’t because I picked some ridiculous price target.
It’s because we’re looking at the trade before everyone is chasing the breakout.
Why Being Early Matters
Imagine TGT eventually trades through $166.50.
Suddenly the chart looks fantastic.
New highs. Breakout scanners. Momentum traders piling in.
Maybe Substack and FinTwit start talking about Target again.
But anyone who entered from the smaller flag has a very different trade by then.
They already have a profit cushion.
Their original risk was defined much lower.
And instead of deciding whether to chase the breakout, they’re deciding how to manage a winner.
That’s a completely different psychological position.
This is one of the biggest advantages of pattern recognition.
You don’t have to predict what happens.
You identify the structure early enough that the math is favorable if you’re right.
This Is the TTI Process
This is also a good example of how our entire system fits together.
The Market Blueprint tells me where I want to be looking.
Right now, retail deserves attention.
The Hit List helps me figure out what stocks inside those areas have the strongest combination of trend, relative strength and momentum.
Then the chart tells me when there may actually be a trade.
And risk management tells me how much I’m willing to lose if I’m wrong.
So:
Blueprint → Where
Hit List → What
Setup → When
Risk → How much
That’s the process.
TGT still needs to do its part.
I want the flag to break. I want the larger structure to remain intact. And I want the entry to stay close enough to the invalidation that the reward-to-risk remains compelling.
If it does, we may have one of those setups traders often assume only exists in hindsight.
It doesn’t require luck.
It requires seeing the structure before it becomes obvious.
The goal isn’t certainty.
The goal is asymmetry.
Follow the money,
Hamilton
Founder, The Trading Initiative
P.S. — If you want to see how I actually apply this process in real time—where I’m looking, what I’m watching, and the setups I’m willing to risk money on—you can join TTI here:
Hi . I was just wondering if you think your trading system can be fully systematized ? Is that something you have tried ?