


Third quarter returns were all over the place
We’re entering the strongest period of the presidential election cycle
The work you do now will set you up for huge success through year end
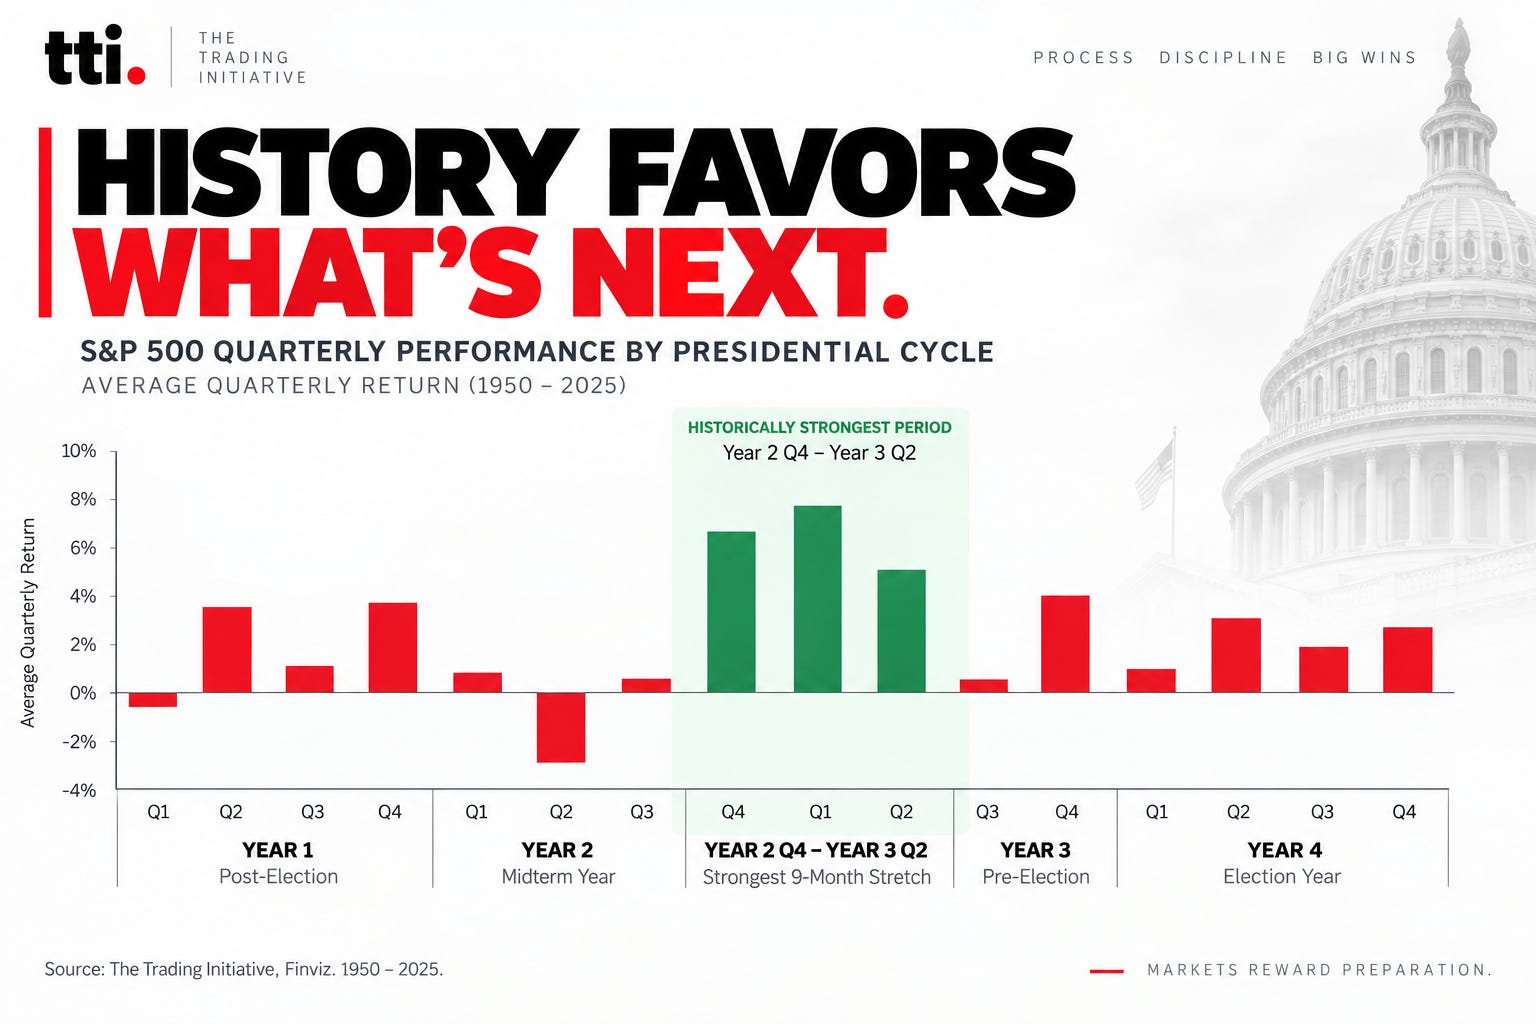
If Q3 felt harder than the S&P 500 made it look, you weren’t imagining things.
The headline index finished the quarter higher. Underneath the surface, though, it was a very different market.
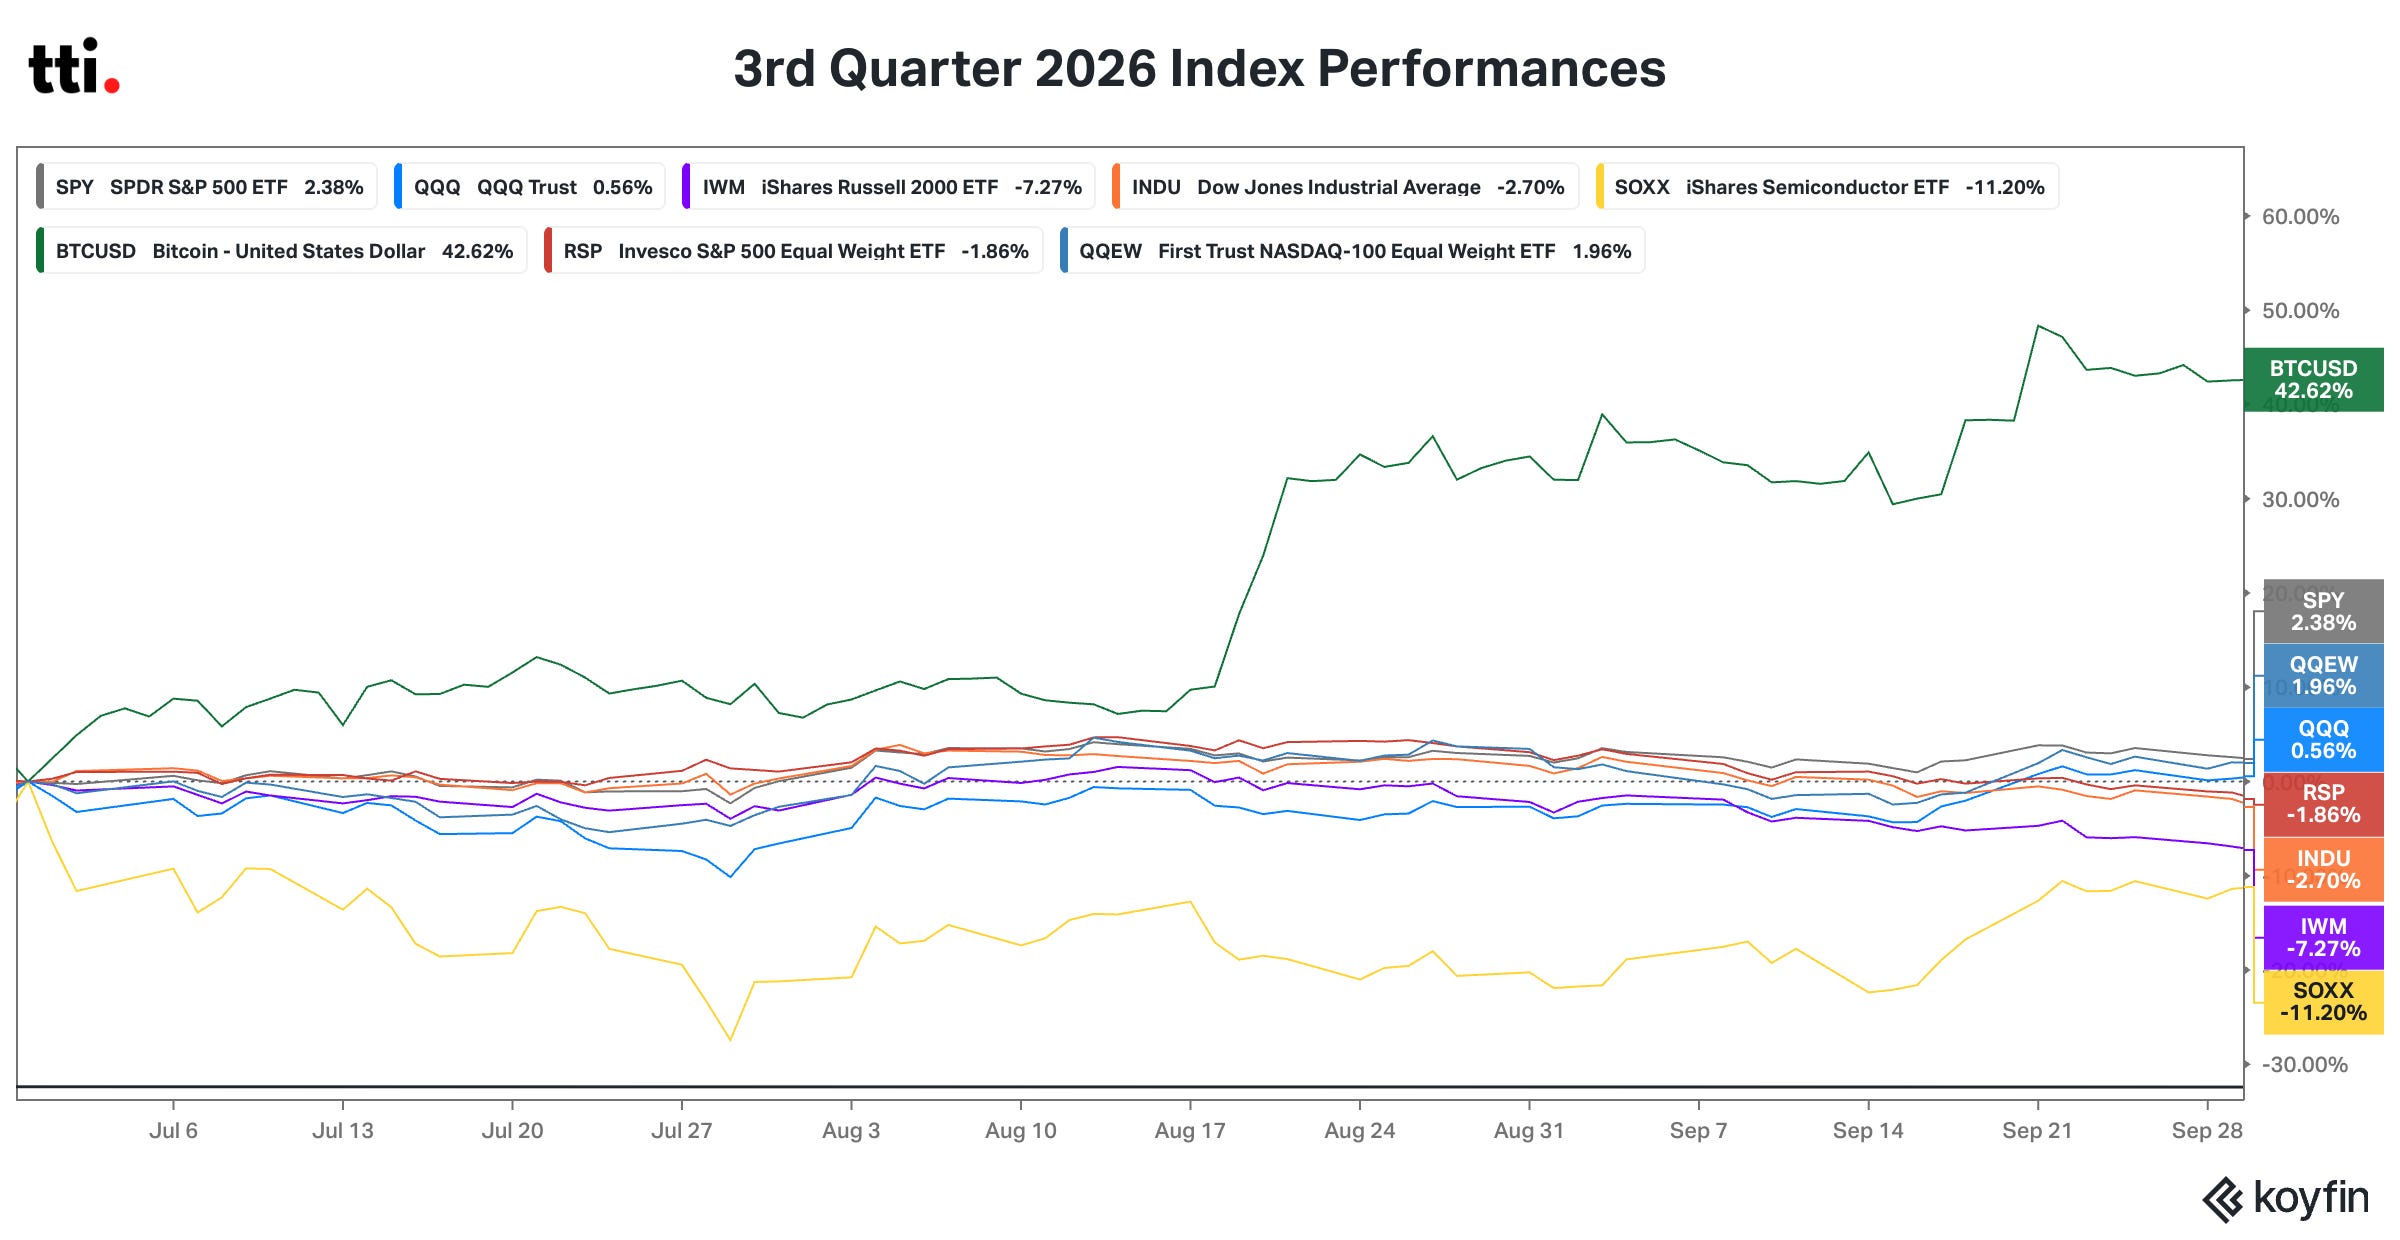
The S&P 500 gained 2.4%. The Nasdaq 100 barely moved. Equal-weight S&P 500 fell 1.9%. The Dow lost 2.7%. Small caps fell more than 7%. Semiconductors got hit for more than 11%.
And then there was Bitcoin.
Bitcoin gained 42.6%.
That’s the kind of divergence I pay attention to.
Q3 wasn’t a quarter where everything worked. It was a quarter that forced the market to show us what was actually strong.
And now, as we turn the calendar into Q4, the historical backdrop gets a whole lot more interesting.
Q3 was a sorting mechanism
There are stretches of the market where you can throw a dart with your eyes closed and make money.
Q3 wasn’t one of them.
The S&P 500’s positive return disguised a lot of weakness underneath the surface. Small caps struggled. Semiconductors struggled. Equal weight struggled. The Dow struggled.
You had to own the right things.
I don’t necessarily view that as bad news.. I view it as information.
Difficult tape forces leadership to reveal itself.
When the market isn’t giving everyone a free ride, the assets that continue making progress stand out. They show relative strength. They attract capital. They refuse to break while weaker assets get sold.
Those are exactly the names I want to know about before market conditions begin to improve.
Because historically, conditions are about to improve.
The strongest part of the presidential cycle starts here
Take a look at this chart.
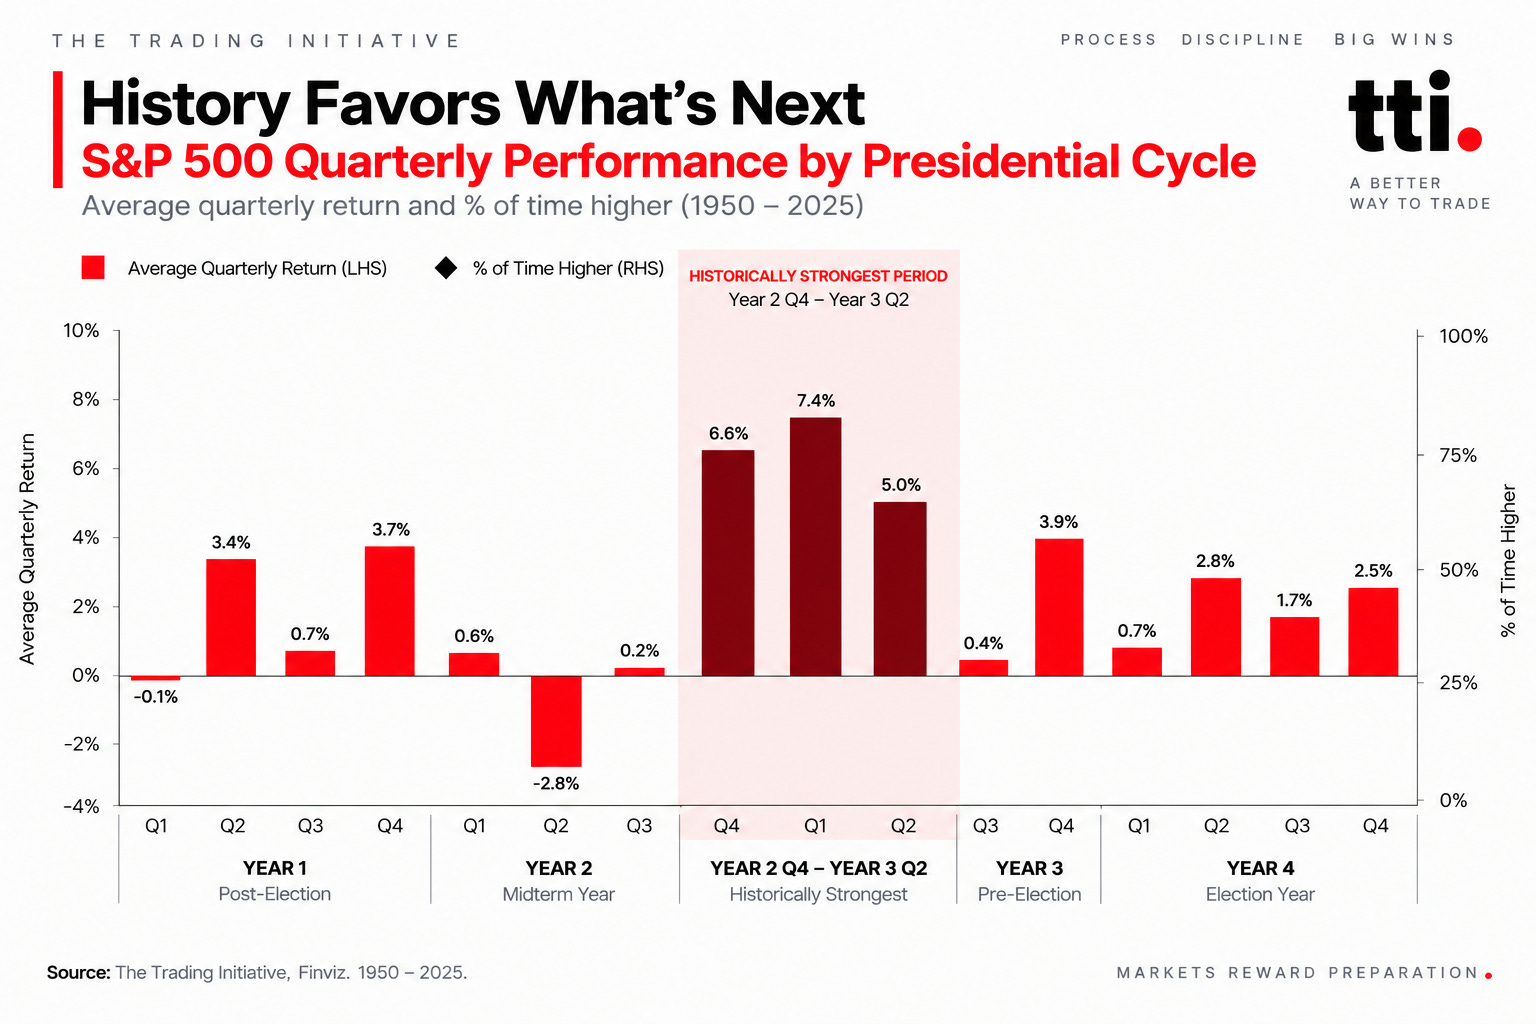
We’re entering Q4 of Year 2 of the presidential cycle.
Historically, the S&P 500 has gained an average of 6.6% during this quarter and finished higher 84.2% of the time.
Then comes Q1 of Year 3. Average return: 7.4%. Positive 94.7% of the time.
Then Q2. Average return: 5.0%. Positive 73.7% of the time.
Together, Q4 of Year 2 through Q2 of Year 3 represents the strongest nine-month stretch of the entire four-year presidential cycle historically.
That doesn’t mean stocks have to go straight up every day starting tomorrow.
Seasonality isn’t a trading system. It doesn’t override price, risk or market structure.
But it absolutely matters as context.
And right now, that context is becoming more favorable at the exact moment Q3 just handed us a very useful list of winners and losers.
You couldn’t ask for a better opportunity in the markets than right now.
Find the leaders before everything gets easy
This is one of the most important parts of my process.
I want to know what was working before everybody starts thinking “we’re so back!”..
If a stock, sector or asset can outperform while the broader market is difficult, that tells me something.
What held its highs? What kept making progress? Where was relative strength improving? Where was capital already flowing?
Which assets refused to sell off even while the rest of the market was struggling?
Those are the names I want to own into a stronger market environment.
Think about it this way:
If something was already winning while everything else was getting destroyed, what happens when the market starts to run again?
You don’t automatically abandon the leader and go hunting for whatever was weakest.
You pay even closer attention to the leader. And if an entry appears.. own it.
October could still make us work for it
There’s another seasonal pattern worth understanding.
Jeff Hirsch’s October work shows that midterm election Octobers have historically been choppy early before strengthening as the month progresses.
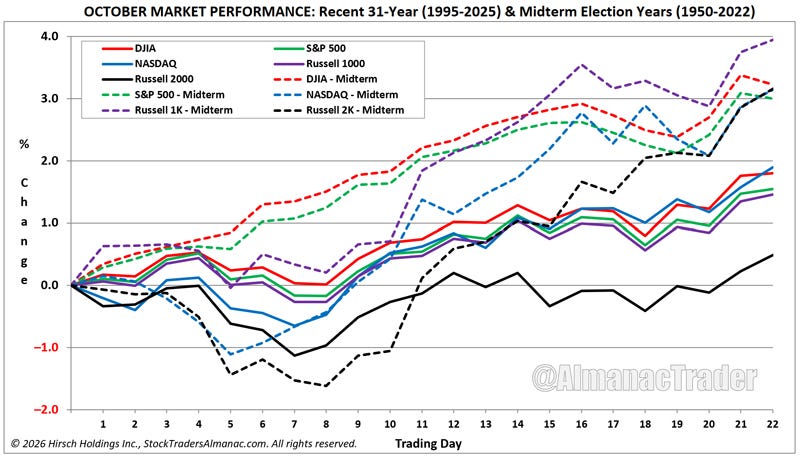
I actually think that fits the setup well.
We don’t need October 1st to mark the beginning of a straight line rally higher.
If we get some weakness or volatility early in the month, that doesn’t automatically invalidate the bigger picture.
What matters is what happens underneath it.
Do the leaders hold up? Does relative strength persist? Does money continue moving toward the same areas? Do the strongest charts continue behaving like the strongest charts?
That’s the information I care about.
Our job isn’t to predict every move in the market. It’s to be prepared when the opportunity arrives.
Q3 was difficult. Good.
But it showed us who the leaders are.
Now we’re entering what has historically been the strongest stretch of the presidential cycle.
I’m optimistic about what comes next.
More importantly, we have a plan for it.
Are you prepared?
Follow the money,
Hamilton
Founder, The Trading Initiative
P.S. This Friday we’re meeting live for our TTI Academy webinar, and I’m going to go much deeper into this setup. We’ll cover the presidential cycle data, October seasonality, the leadership coming out of Q3, Bitcoin, and the stocks and themes we’re preparing for as we move into what has historically been the strongest stretch of the cycle. If you want to follow the process with us in real time, join The Trading Initiative. Click here to learn more.
That's an interesting fact about the S&P and the years of presidential