


Before we get into DBX, I want to show free readers how our research becomes a trade inside The Trading Initiative.
If you want to work through setups like this with us, join TTI Membership here. Membership brings together our Market Blueprint and Hit List processes, the TTI Trade Desk, research, live coaching, and private Discord with weekday live trading.
Our paid Substack is a separate way to follow the nightly scanner reports:
Every night, paid members receive a complete TTI scanner report, rotating through the different setups we use to find leadership, breakouts, pullbacks, event-driven opportunities and potential squeezes.
Each report is filled with actionable setups to research, plan and monitor.
They aren’t automatic buy signals.
They’re where the trading process begins.
Paid members also receive occasional trade ideas, trade reviews and special reports where I walk through the process behind a position.. from what originally caught our attention to how we structured and managed the trade.
The report below is an example of what paying members can expect.
I originally planned to keep it exclusively for them, but I decided to open this one to everyone so you can see exactly what we’re building.
This is a complete look at how one of our current trades developed from an early scanner candidate into a confirmed industry leader.
And yes.. this is written with AI. Except this line :) enjoy!
- Hamilton
On August 19, Dropbox (DBX) appeared near the top of the Squeeze Radar report we sent to paid members.
Since then, the stock has gained roughly 5%, closed the week at eight-year highs and our January 2027 $40 calls are now up more than 40%.
But this isn’t a report about celebrating a winning trade after the fact.
DBX appeared across four different scans as the evidence continued developing.
Then the broader software industry began confirming what the individual stocks had already been telling us.
The value isn’t knowing that DBX went up. It’s seeing that the evidence existed before the outcome became obvious.
What the Scanner Saw
When paid members received the Squeeze Radar on August 19, DBX ranked third out of the 20 stocks that qualified.
Here’s what the scanner saw:
• TTI Score: 88
• Trend: 96
• Relative Strength: 79
• Momentum: 88
• Short interest: Approximately 18% of available shares
• Days to cover: 7.02
• Price at the time of the scan: $33.99
That combination gave us several important pieces of information.
The stock was already trending higher.
Momentum was accelerating.
Relative strength was improving.
And a meaningful number of traders were still positioned against it.
That’s what put DBX on the Squeeze Radar.
But the scan wasn’t a buy signal.
It identified the candidate.
Price still had to confirm the setup, risk still had to be defined and the trade still had to make sense inside the portfolio.
How the Evidence Developed
DBX didn’t appear once and disappear.
It continued showing up as the stock moved through different stages of leadership.
August 19: Squeeze Radar
DBX ranked third out of 20 candidates with a TTI Score of 88.
August 20: Emerging Leaders
One day later, DBX ranked fourth out of 24 names as its leadership continued improving.
August 24: Established Leaders
By Monday, its Trend Score had climbed to 98 and its Relative Strength reached 80.
The emerging leader had graduated into established leadership.
August 26: Group-Confirmed Leaders
DBX then appeared on our Group-Confirmed Leaders scan, showing that its strength was receiving support from the broader software industry.
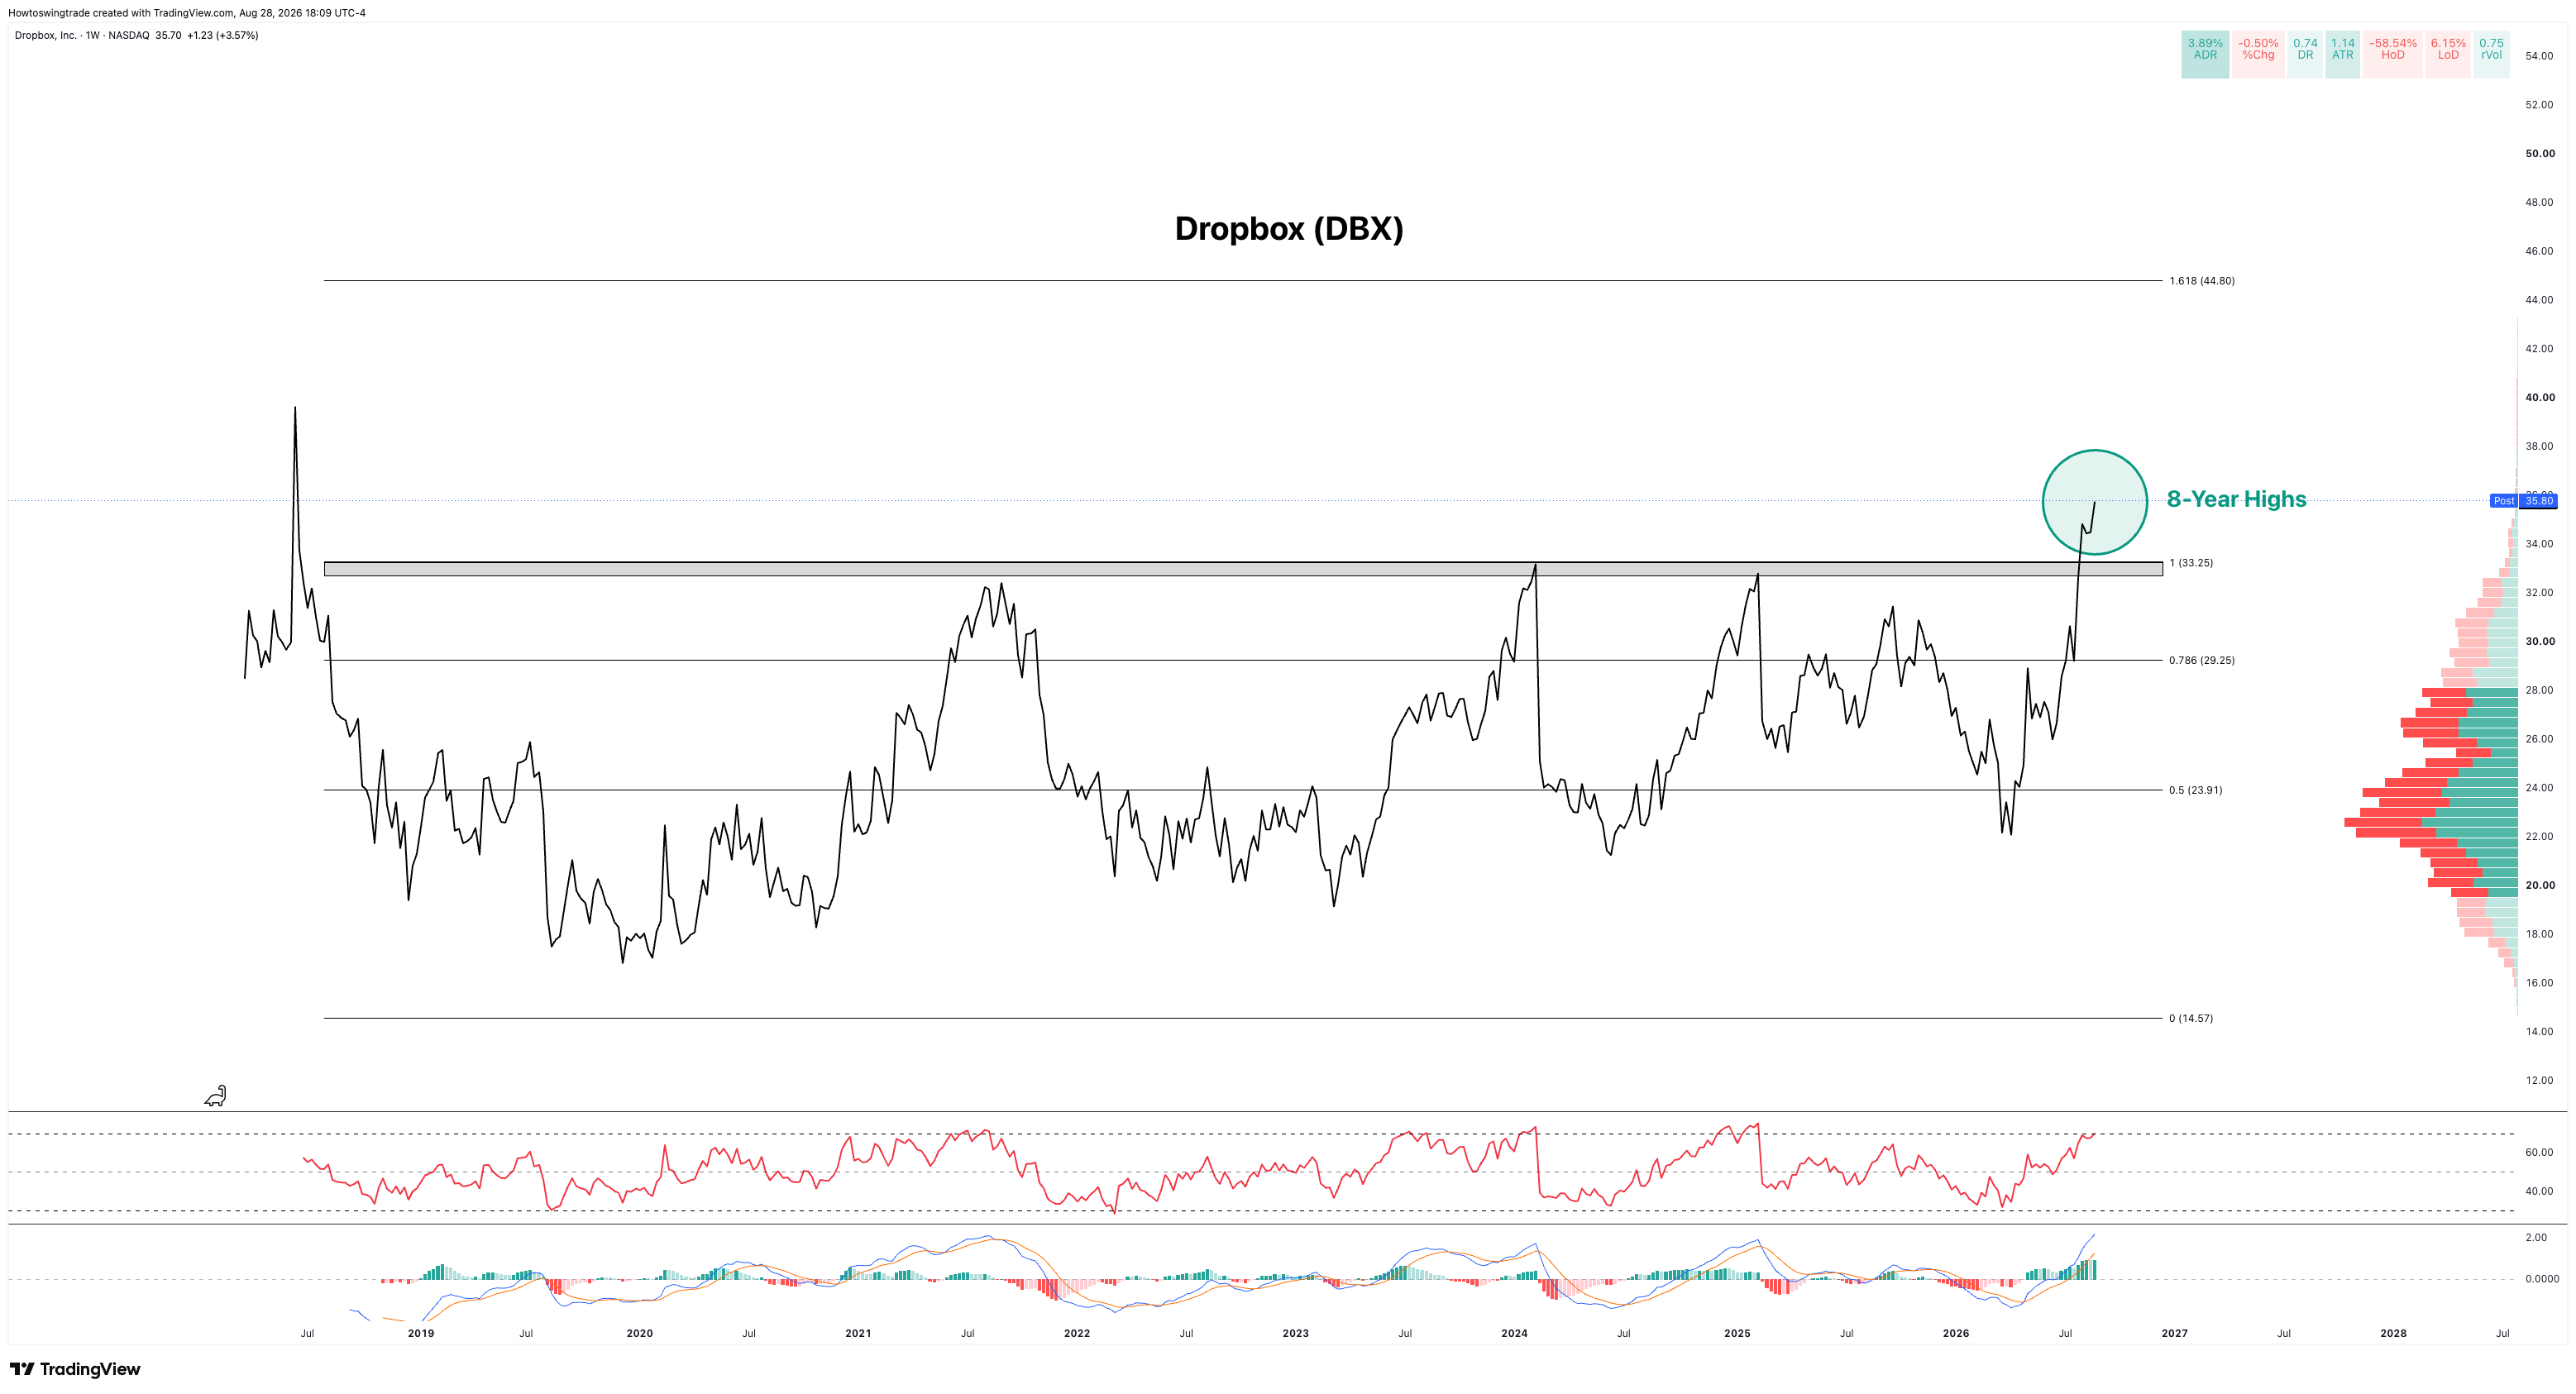
August 28: Eight-Year Highs
DBX finished the week near $35.70 after clearing the resistance area around $33.25 that had contained the stock for several years.
The scanner didn’t predict the breakout.
It documented the evidence getting stronger before the breakout made the story obvious.
The Position at a Glance
Underlying: DBX / Dropbox
Directional thesis: Bullish
Core position: Shares
Options sleeve: January 15, 2027 $40 Calls
Options return: More than 40% at Friday’s close
Original Squeeze Radar price: $33.99
Friday’s closing price: Approximately $35.70
Current technical state: Breakout above the long-term $33.25 resistance area and the highest weekly close in roughly eight years
First technical warning: A sustained failure back beneath the former breakout area
These aren’t intended to be instructions to chase DBX after the breakout.
They represent how the existing position was structured and what we’re watching as the trade develops.
The shares remain the foundation of the trade.
The calls add a small sleeve of convexity.
That simply means that if DBX produces a larger move, the options have the potential to gain value faster than the underlying shares.
But the calls aren’t a lottery ticket.
They can still lose their entire premium.
The stock chart creates the trade.
The option contract only changes how we choose to express a small part of it.
We begin with the underlying setup, define the risk and only then decide whether an options sleeve can improve the potential payoff.
What the Market Blueprint Is Confirming
DBX wasn’t the only software stock we bought over the last two weeks.
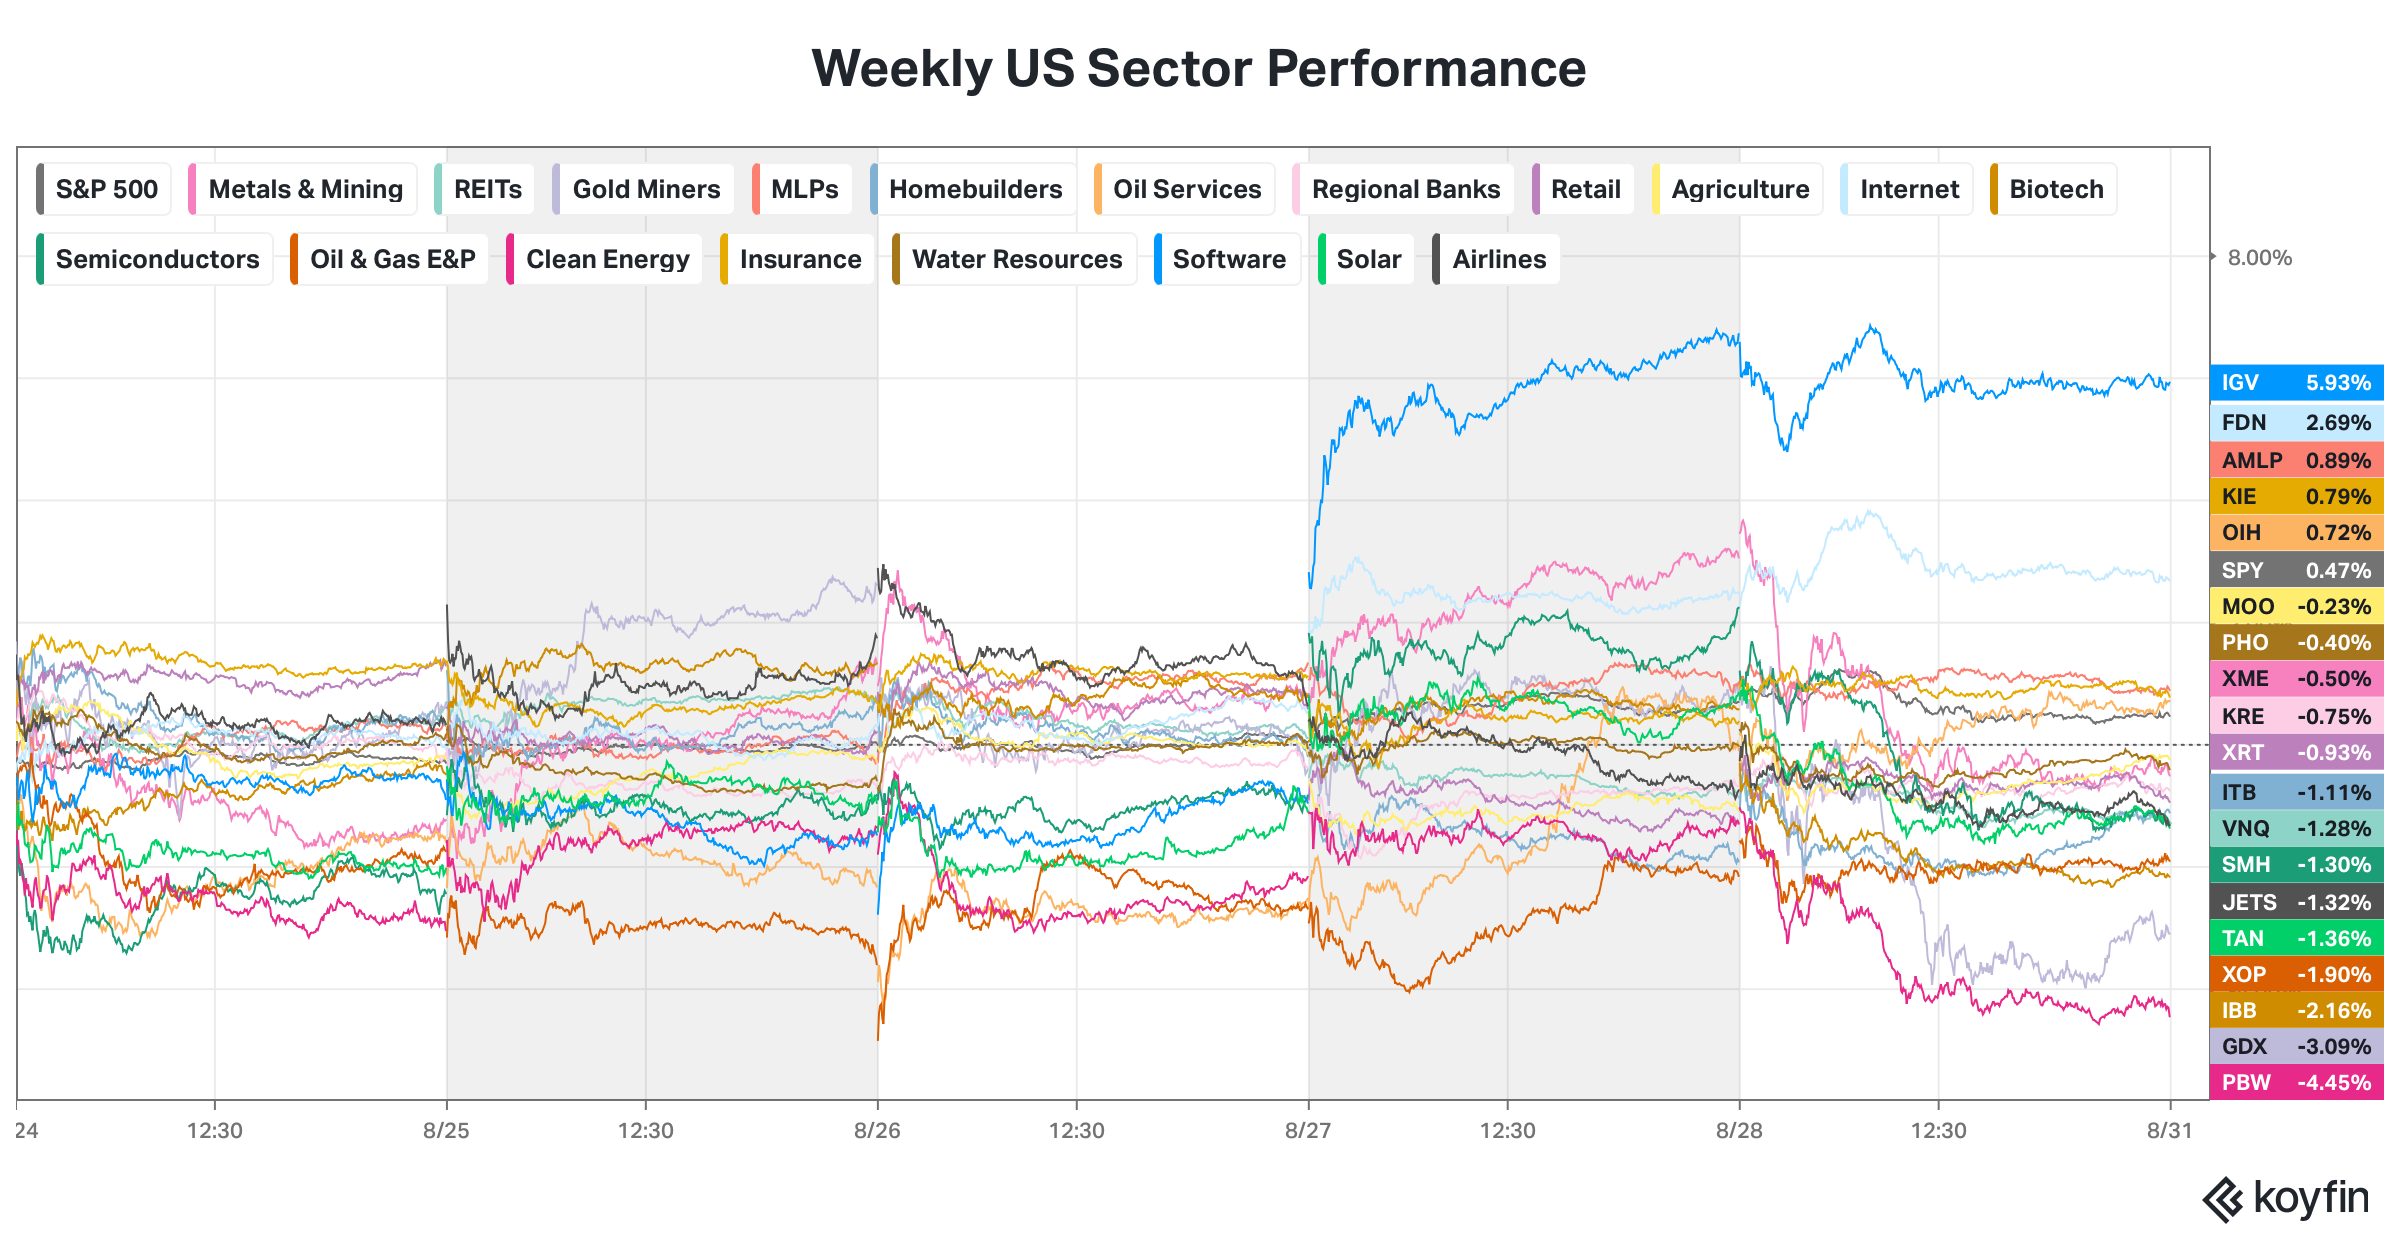
Our bottom-up Hit List process was identifying improving software stocks before software appeared at the top of the weekly performance table.
Now the top-down evidence is arriving.
Software, represented by IGV, gained 5.93% this week.
The S&P 500 gained only 0.47%.
Software didn’t merely rise..
It outperformed the broader market by more than five percentage points.
One strong stock can be a company-specific story.
Several strong stocks moving together usually tell us that capital is rotating into the group.
That’s where the Market Blueprint becomes important.
The Hit List helps us identify individual stocks attracting capital.
The Market Blueprint tells us whether those individual trades are developing inside a supportive market environment.
Bottom-up helped us get positioned.
Top-down is now helping confirm why the positions are working.
Why Equal-Weight Software Matters
There’s one more piece of confirmation.
IGV can be heavily influenced by its largest holdings.
A small number of large software companies can make the entire industry appear stronger than the average stock underneath it.
That’s why we also watch XSW, the equal-weight software ETF.
XSW finished the week at new all-time highs.
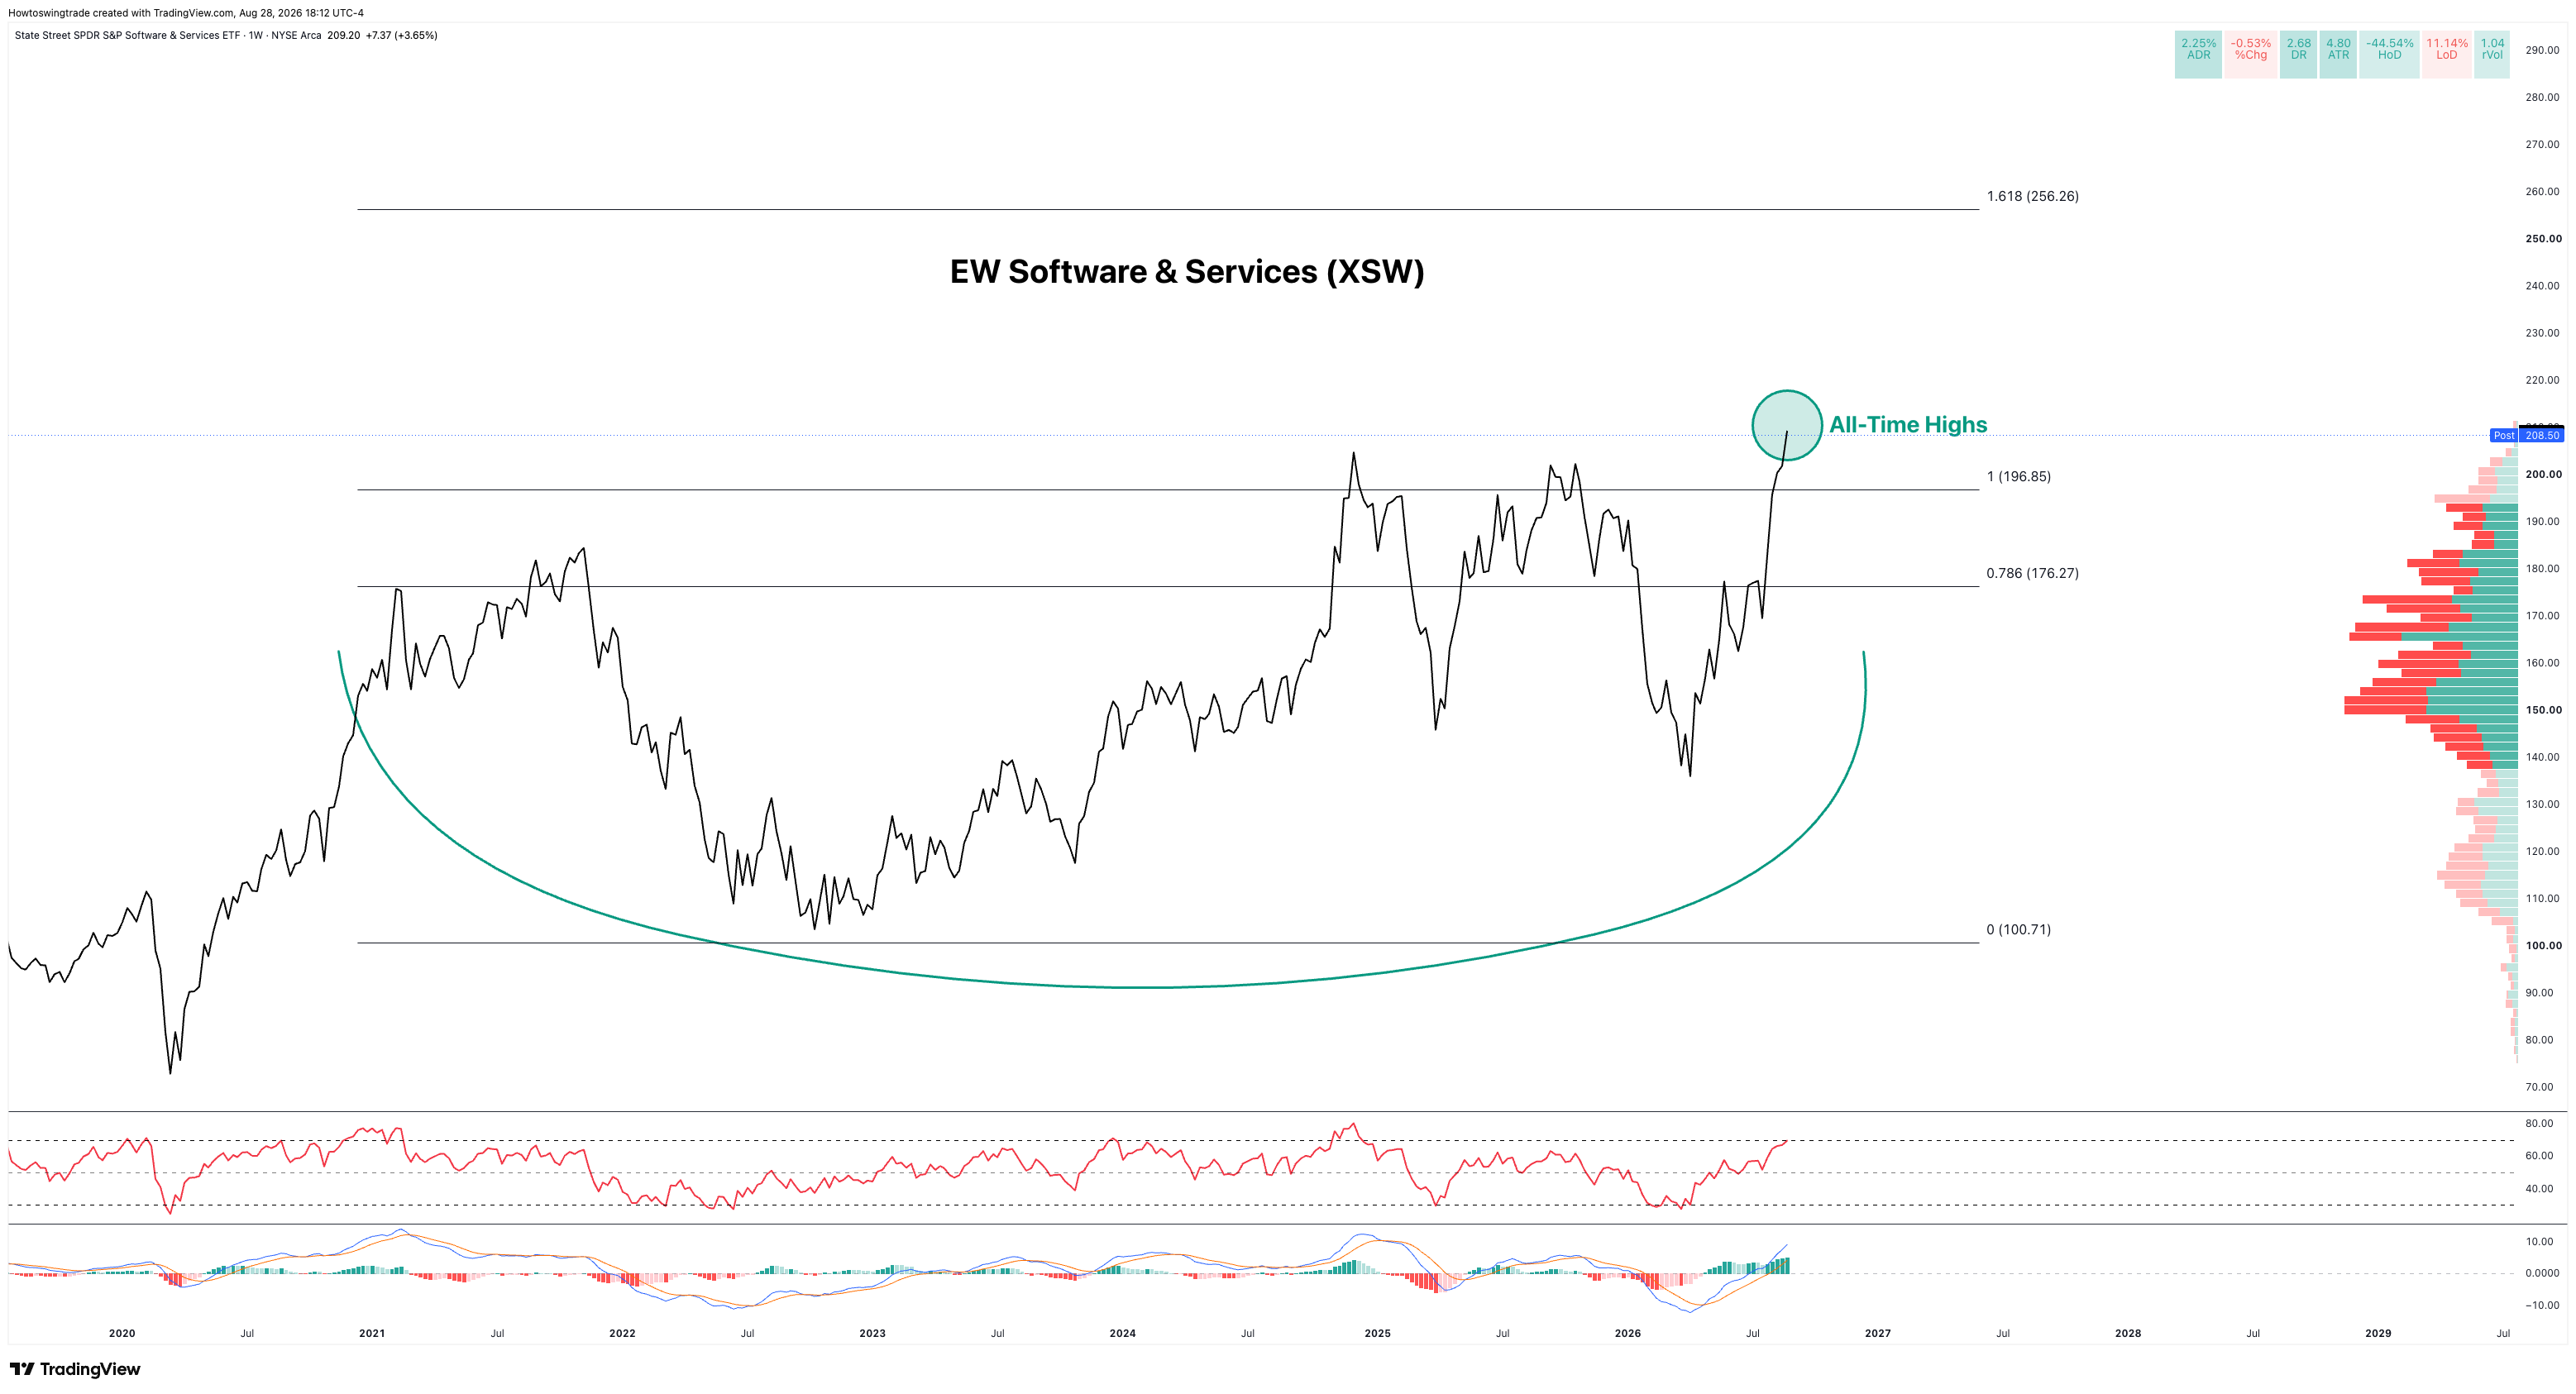
That tells us participation is broadening beyond only the largest software companies.
Capital is moving through the industry.
This doesn’t guarantee that software continues leading.
Nothing does.
But it strengthens the evidence that DBX isn’t moving in isolation.
The individual stock led first.
The broader group is now confirming it.
Why I Wanted You to See This
The daily scans tell you where to look.
But finding a candidate, building a trade and managing the position are three different jobs.
The scanner identified DBX before the eight-year breakout.
The Hit List turned the underlying evidence into an actual position.
The options sleeve added defined-risk convexity without replacing the shares.
The Market Blueprint is now confirming the institutional rotation into software.
And inside the TTI Trade Desk, members can see our trades streamed through the Trades tab as we manage them.
No single tool does everything.
The scanner finds the possibility.
The Hit List makes the decision.
The Market Blueprint confirms the environment.
The Trade Desk shows the execution.
That complete process is what this report is really about.
Want to See the Scans Before the Breakout?
Paid members received the complete Squeeze Radar on August 19, before DBX reached eight-year highs.
Paid Substack membership includes the complete nightly scanner reports, rotating through the different TTI setups, along with occasional trade ideas and reviews like this one.
Want to Follow the Trades We Actually Take?
TTI Membership is where we put this whole process to work together. The Market Blueprint helps us build the bigger picture. The Hit List is how we narrow the field and turn individual stock setups into trades. Both are included in Membership.
Members get the research, TTI Trade Desk, live coaching, and private Discord with weekday live trading to follow how we plan, enter, and manage positions.
Join TTI Membership to work through the next setups with us.
For educational and informational purposes only. This report is not individualized investment advice or a recommendation to buy or sell any security. We currently hold DBX shares and January 15, 2027 $40 calls. Positions, risk levels and trade management may change after publication. Options involve substantial risk and can expire worthless.