


What you’re about to read is 17-years worth of trying to figure this whole thing out. What started out as a brain dump ended up being a four hour article. I hope it helps.
If you’re new here, this is the place to start. I’ll walk you through how I narrow a whole market down to a few stocks, decide whether a setup is worth taking, and define what I’m willing to lose before I enter.
It’s also the process behind The Trading Initiative. Understanding it will help you decide whether the way we work is a fit for how you want to trade.
I’ve tried everything from scalping to day trading, swing trading to position trading. Name an indicator or a strategy and I’ve probably lost money trying to figure it out.
The truth is.. there’s no perfect system for everyone. There’s only a perfect system for you.
Over the course of my career, I’ve taken bits and pieces from some of the greats..

Charles Dow taught me that markets move through trends.. and that the primary trend is the most important.
Richard Wyckoff taught me that institutional volume was at the crux of these trends.. and how to follow them.
Stan Weinstein taught me that trends move in cycles.. and how to make money from them.
George Soros taught me to be a pig in a bubble.. and to go for the jugular when I found myself in a massive trade.
And the list goes on.
But no one taught me more about the actual in’s and out’s of trading — at least, not initially — than Richard Dennis, Bill Eckhardt, and the Turtle Traders.
Right before writing this, I just stumbled upon a PDF that I first read back in 2012 that completely changed the way I viewed trading.
I’m not talking about how I view the markets.. I’m talking about the actual trading part of this whole thing.
Entries. Stops. Position sizing. Risk management. Stock selection. And more.
You know.. the stuff that differentiates the chart monkeys who throw thousands of charts out at you every day from the people who actually make money in the markets.
And yes.. those are very often two very, VERY different types of people.
So here’s your opportunity..
Learn from my mistakes. Over the next ten minutes, I hope to help you do a lot more learning and a whole lot less losing.
PS. Here’s the link to the original PDF if you want to read it afterwards.
I’m a Product of the 80’s
Yes. I was born in the ‘80s. But that’s not the point.
If you don’t know who the Turtle Traders are.. let me explain it briefly.
The Turtle experiment began in the 1980’s with an argument somewhere in downtown Chicago.
Richard Dennis and William Eckhardt were two successful commodities traders with different beliefs about where trading ability came from.
Dennis believed traders could be taught.. while Eckhardt believed that trading was largely a natural ability.
So they made a bet.
They recruited people with little or no professional trading experience, brought them to Chicago, taught them a set of rules, and eventually gave them real money to manage.
The experiment became legendary.
But what Dennis taught the Turtles wasn’t a secret indicator.
As a matter of fact, the Turtles entered trades using simple price breakouts.
One system entered when price exceeded its previous 20-day high or low.. another used 55 days.
They measured volatility using something called N, which was similar to what traders now know as Average True Range (ATR).
They added to winning positions at predetermined intervals. They placed stops according to volatility. They capped exposure across individual and correlated markets. And they exited when price broke in the opposite direction.
None of those rules was particularly complicated.
And that was the point.
Dennis didn’t try to teach the Turtles how to predict every move.
Instead.. he gave them a process for responding to whatever the market did next.
The system told them what they could trade, how much they could risk, when they could enter, where they had to admit they were wrong, how they would leave a winner, and how they should execute.
Very little was left to discretion. That’s what made it a complete trading system.
The Difference Between a Strategy and a System
I get asked some version of this question all the time.. how do you actually find your trades?
Most expect me to say something along the lines of “I buy breakouts” or “I use unusual options flow.”
And while those are beneficial in their own right.. those aren’t a system.
Those are strategies within a broader system.
Most traders approach trading the wrong way.. they obsess over strategies. I used to obsess over strategies.
They find a stock they like, build a story around it, and then find a chart for some reason to buy it.
I spent a lot of years doing that too. And lost a lot of money until realizing that it just doesn’t work that way.
It feels productive because you can always find one strategy that will agree with you.
But that isn’t a durable trading process.. it isn’t a system.
My system asks five questions:
1. What kind of market are we in?
2. Where is the money flowing?
3. Which stocks are leading inside those areas?
4. Do any of the stocks have actionable setups?
5. Can an options overlay add convexity and increase the payoff?
Only then do I buy.
Building the Big Picture
Everything I do starts with building the bigger picture.
Where are institutions moving their money. That’s it. That’s what I want to know.
I track it multiple ways.. through the primary trend of major market indexes, ETF fund flows, through sector and industry performance, through factor and inter/intra market analysis.. there are a lot of ways to figure this out.
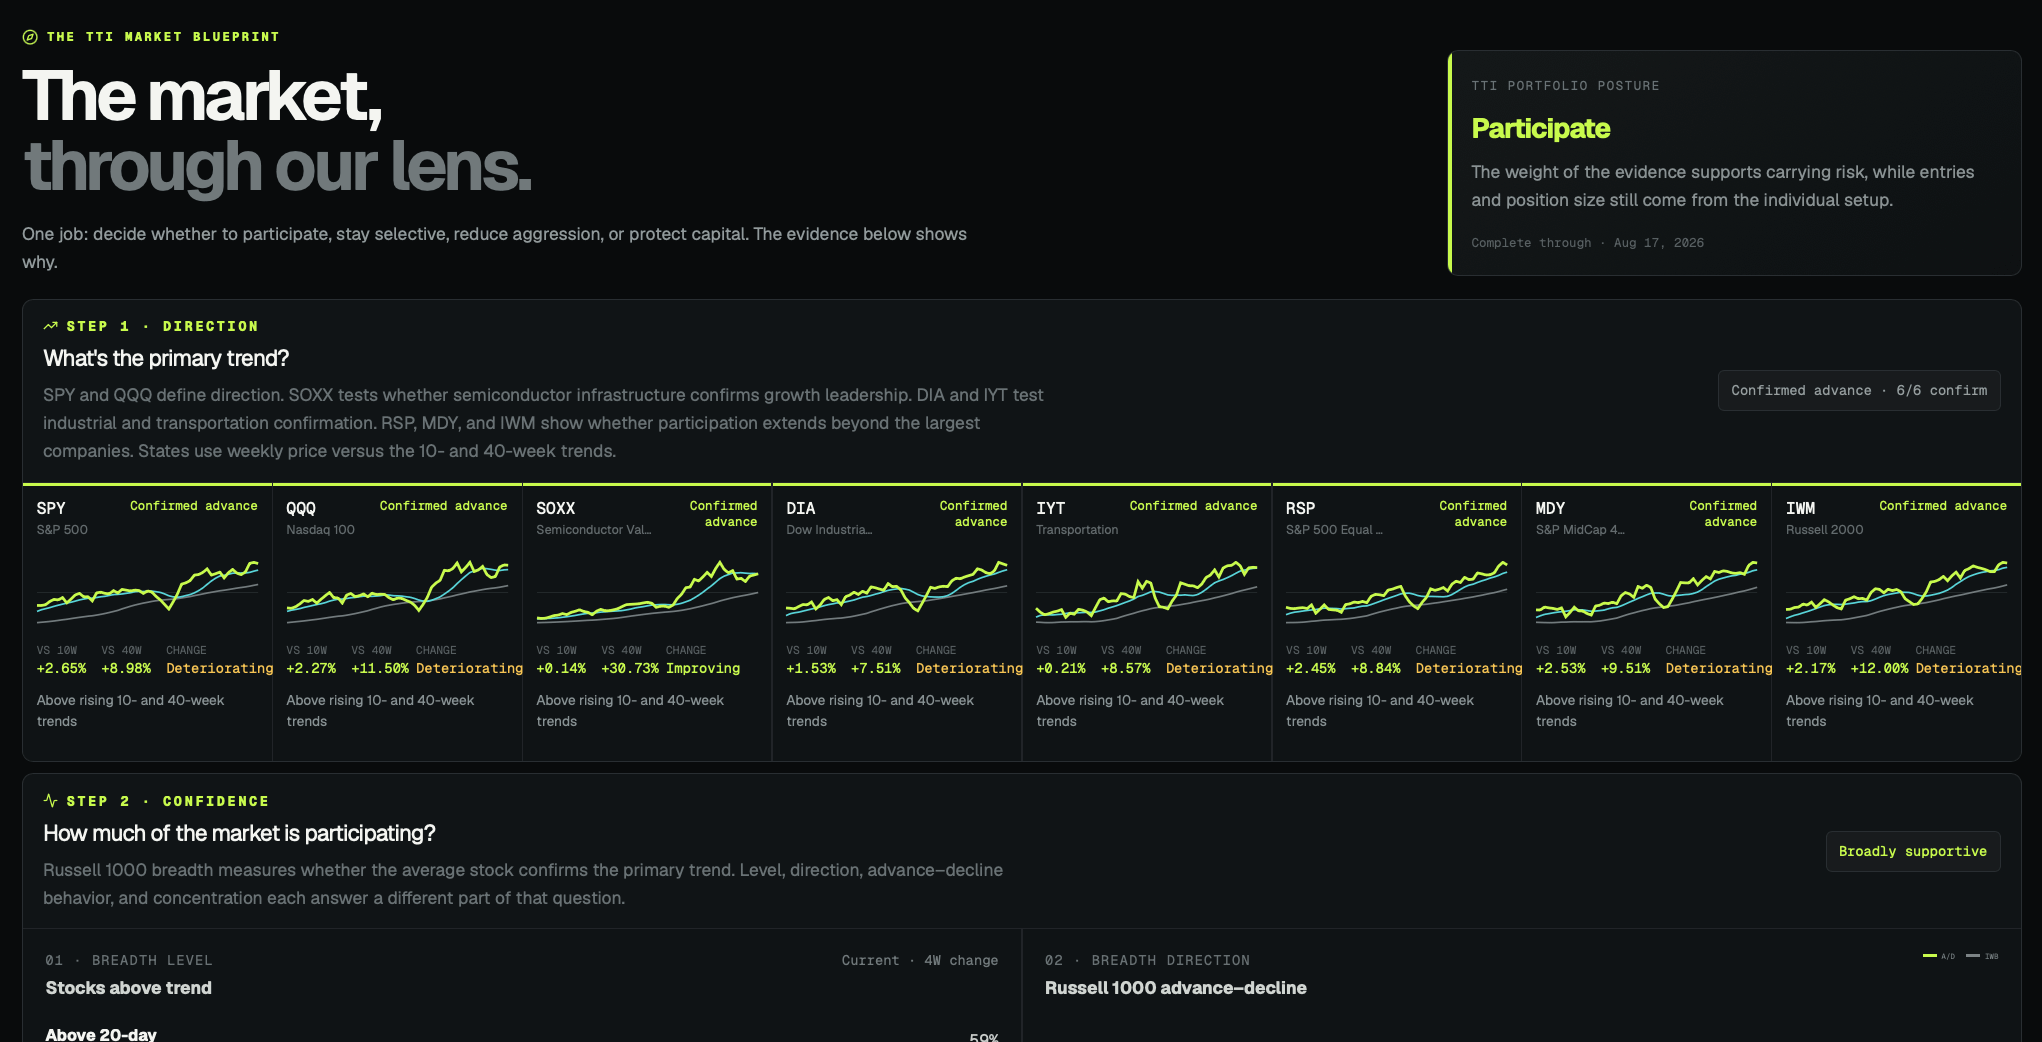
I call this process the Market Blueprint.
The point isn’t to predict the next move in the S&P 500.
As a matter of fact I’m one of the worst people I know in pretending to guess which way the markets are going to move over the next 24 hours.
But over the next couple of weeks? Months? I’m pretty god damn good.
The point is to clearly understand the environment surrounding every trade I might take.
A good setup can still fail in a healthy market. Happens from time to time.
But a good looking setup in the bad market is going to fail more often than not.
Think of it like.. swimming upstream.
You can be a strong swimmer and do everything right..
But the current still determines how hard it’s going to be.
I want the “market’s current” helping all of my trades whenever possible.
Following Leadership Down the Market
Once I understand the broad market, I begin narrowing everything down.
It looks something like this:
Market
Sector
Industry
Stock.
Relative strength is the thing connecting all four.
A stock can rise 10% and still be weak if the market rises 20%.
You may think you made money.. and you did. Congrats! But you also paid something I like to call opportunity cost.
The opportunity cost you pay for holding underperforming trades when there were better opportunities somewhere else in the market. It sucks. It happens. But we want to minimize it.
I would rather find stocks outperforming the market, inside industries outperforming their sectors, inside sectors outperforming the market.
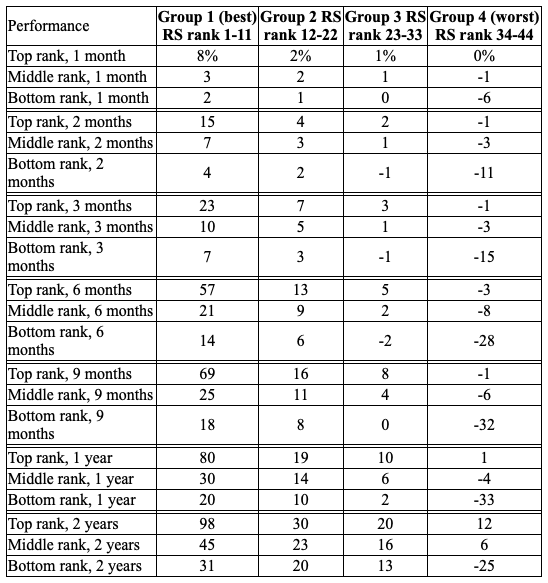
When everything’s moving together.. that’s when I know that the market has its current behind the theme.
This is also where capital flow evidence becomes useful.
I like to look at where money is concentrating, whether or not participation is expanding, and how price responds to it all.
Contrary to popular belief.. positive capital flow is not a buy signal.
Large traders can be early, hedged, or wrong. Fund flows can chase a move after the best opportunity has already passed. It’s in our nature to do so.
So I use capital flow to ask better questions..
Then I let price answer them.
While capital flows offer evidence of how mature a trend may be, price remains the ultimate authority.
Building a Small List from a Large Market
Only after I run through my entire top down process do I begin looking for individual trade setups.
Again.. after 17 years I can tell you this.. the goal is NOT to find more trades. It’s to eliminate most of the shitty ones.
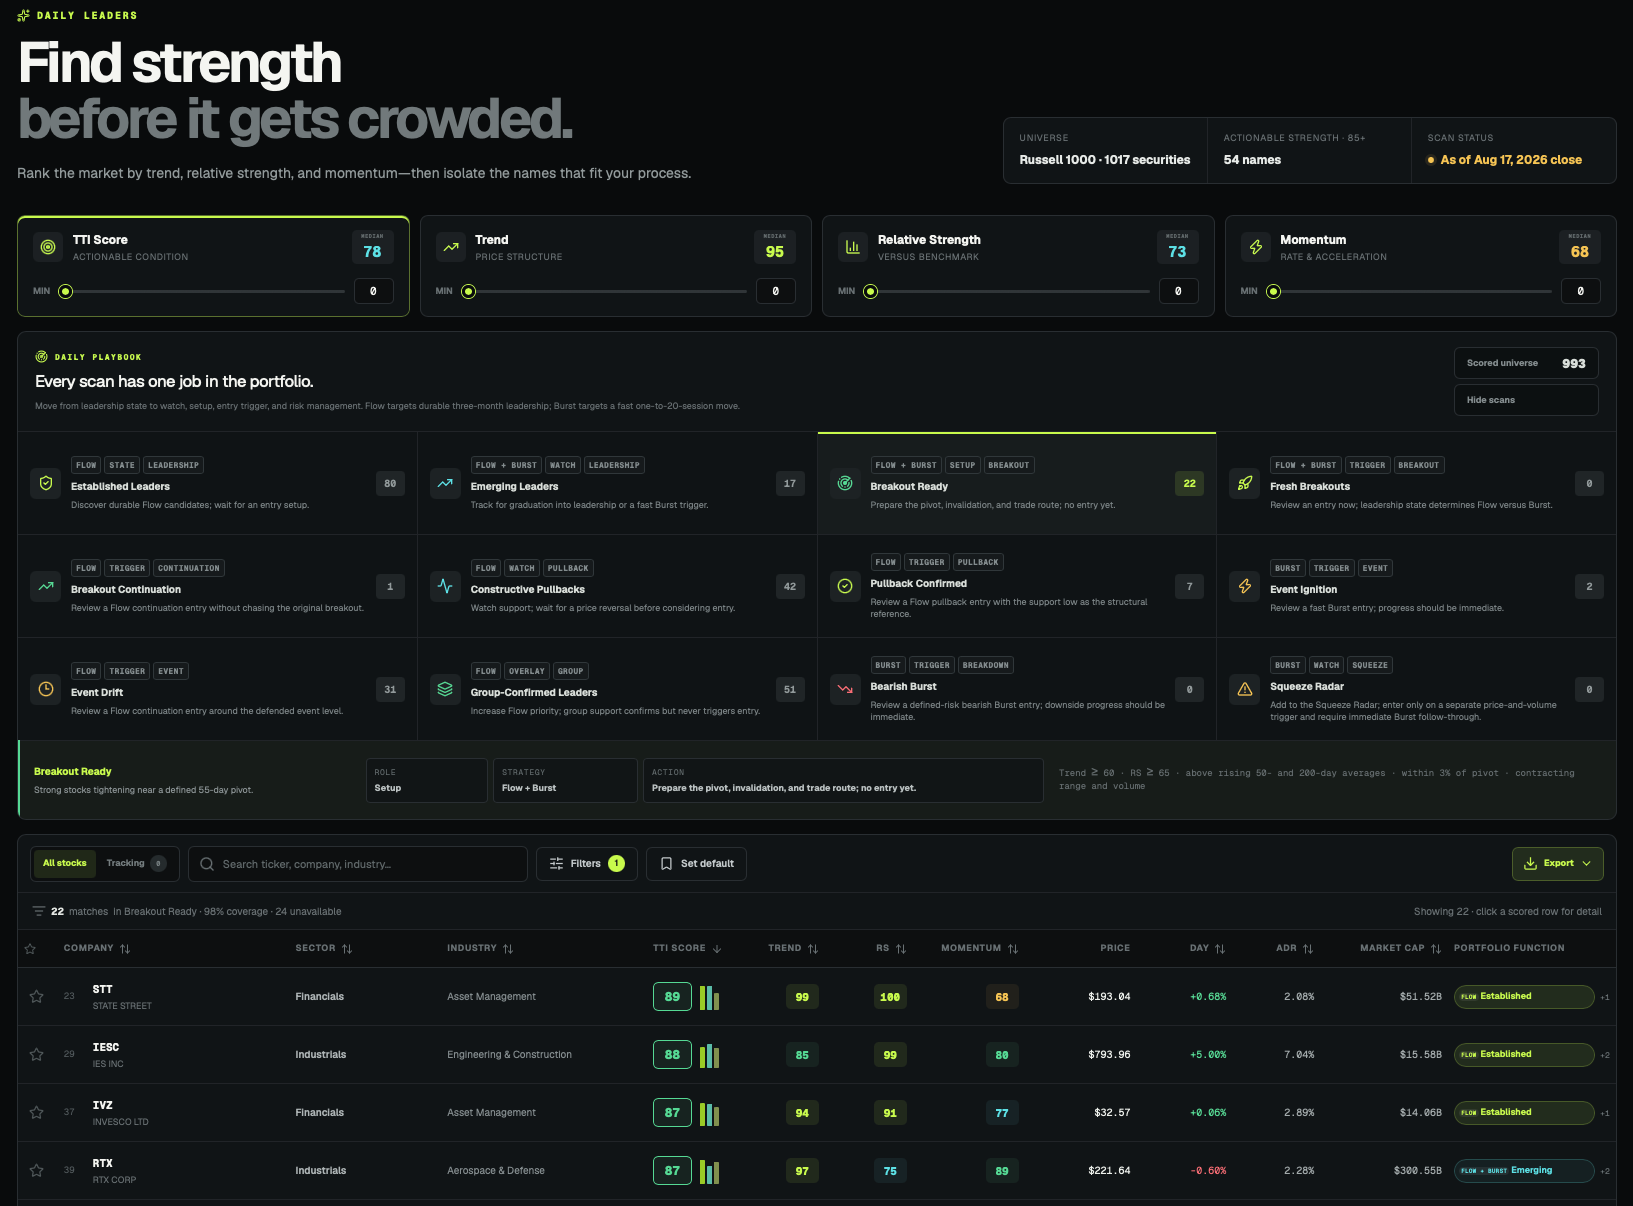
I built and use the TTI Scanner to work through a broad market universe and look for a combination of:
A healthy long term trend.
Relative strength against the market, sector, and industry.
Momentum that’s improving rather than fading.
Real participation as price moves.
Enough liquidity to enter and exit cleanly.
A chart that offers a definable trade instead of simply looking good.
I’ll scan through thousands of stocks per night looking for charts that have all six of those prerequisites.
Most don’t make it. Some have strong trends but no entry. Some have momentum but are already way too far extended. Some have the perfect setup but terrible liquidity.
Those names get nixed off my list. Gone. Goodbye. I don’t care how popular they are on FinTwit.
My edge isn’t that I can watch more stocks than everyone else.. my edge is that I have a repeatable way to stop watching stocks that suck that I have built and honed over a decade of winning and losing.
Inside TTI, the scanner sits alongside the market research and trade planning in The TTI Trade Desk. You can work from the market environment down to an individual stock, then examine the setup, the trigger, and the risk.
When a trade is shared, you can also see the entries, adjustments and exits. That lets you study how the original plan develops as price changes.
Finding the stock is one step. The value comes from connecting it to everything that happens before and after.
I Can Wait A Long Time
A stock showing up on the TTI Scanner does not automatically mean that it’s a trade I am willing to put on.
This is where 17 years of experience really comes in to play.. patience matters.
I want to know where buyers are actively proving themselves, where sellers might regain control, and what price would have to do next to shift the odds in my favor.
As a matter of fact one of my core entry setups is the breakout-retest-bounce.. or the BRB Setup.
I look for price clearing an important resistance level and instead of chasing the first breakout higher, I wait to see whether the old resistance can become new support.
If buyers can defend that area and price turns higher, I know that..
Buyers were strong enough to create the breakout (as opposed to sellers being weak).
Sellers were unable to force price back into the old range (buying demand is stronger than selling pressure).
I have a logical level that tells me where the trade idea fails.
Here’s what that looked like on Exxon Mobil (XOM). The following examples were documented when I originally published this article on August 18, 2026.
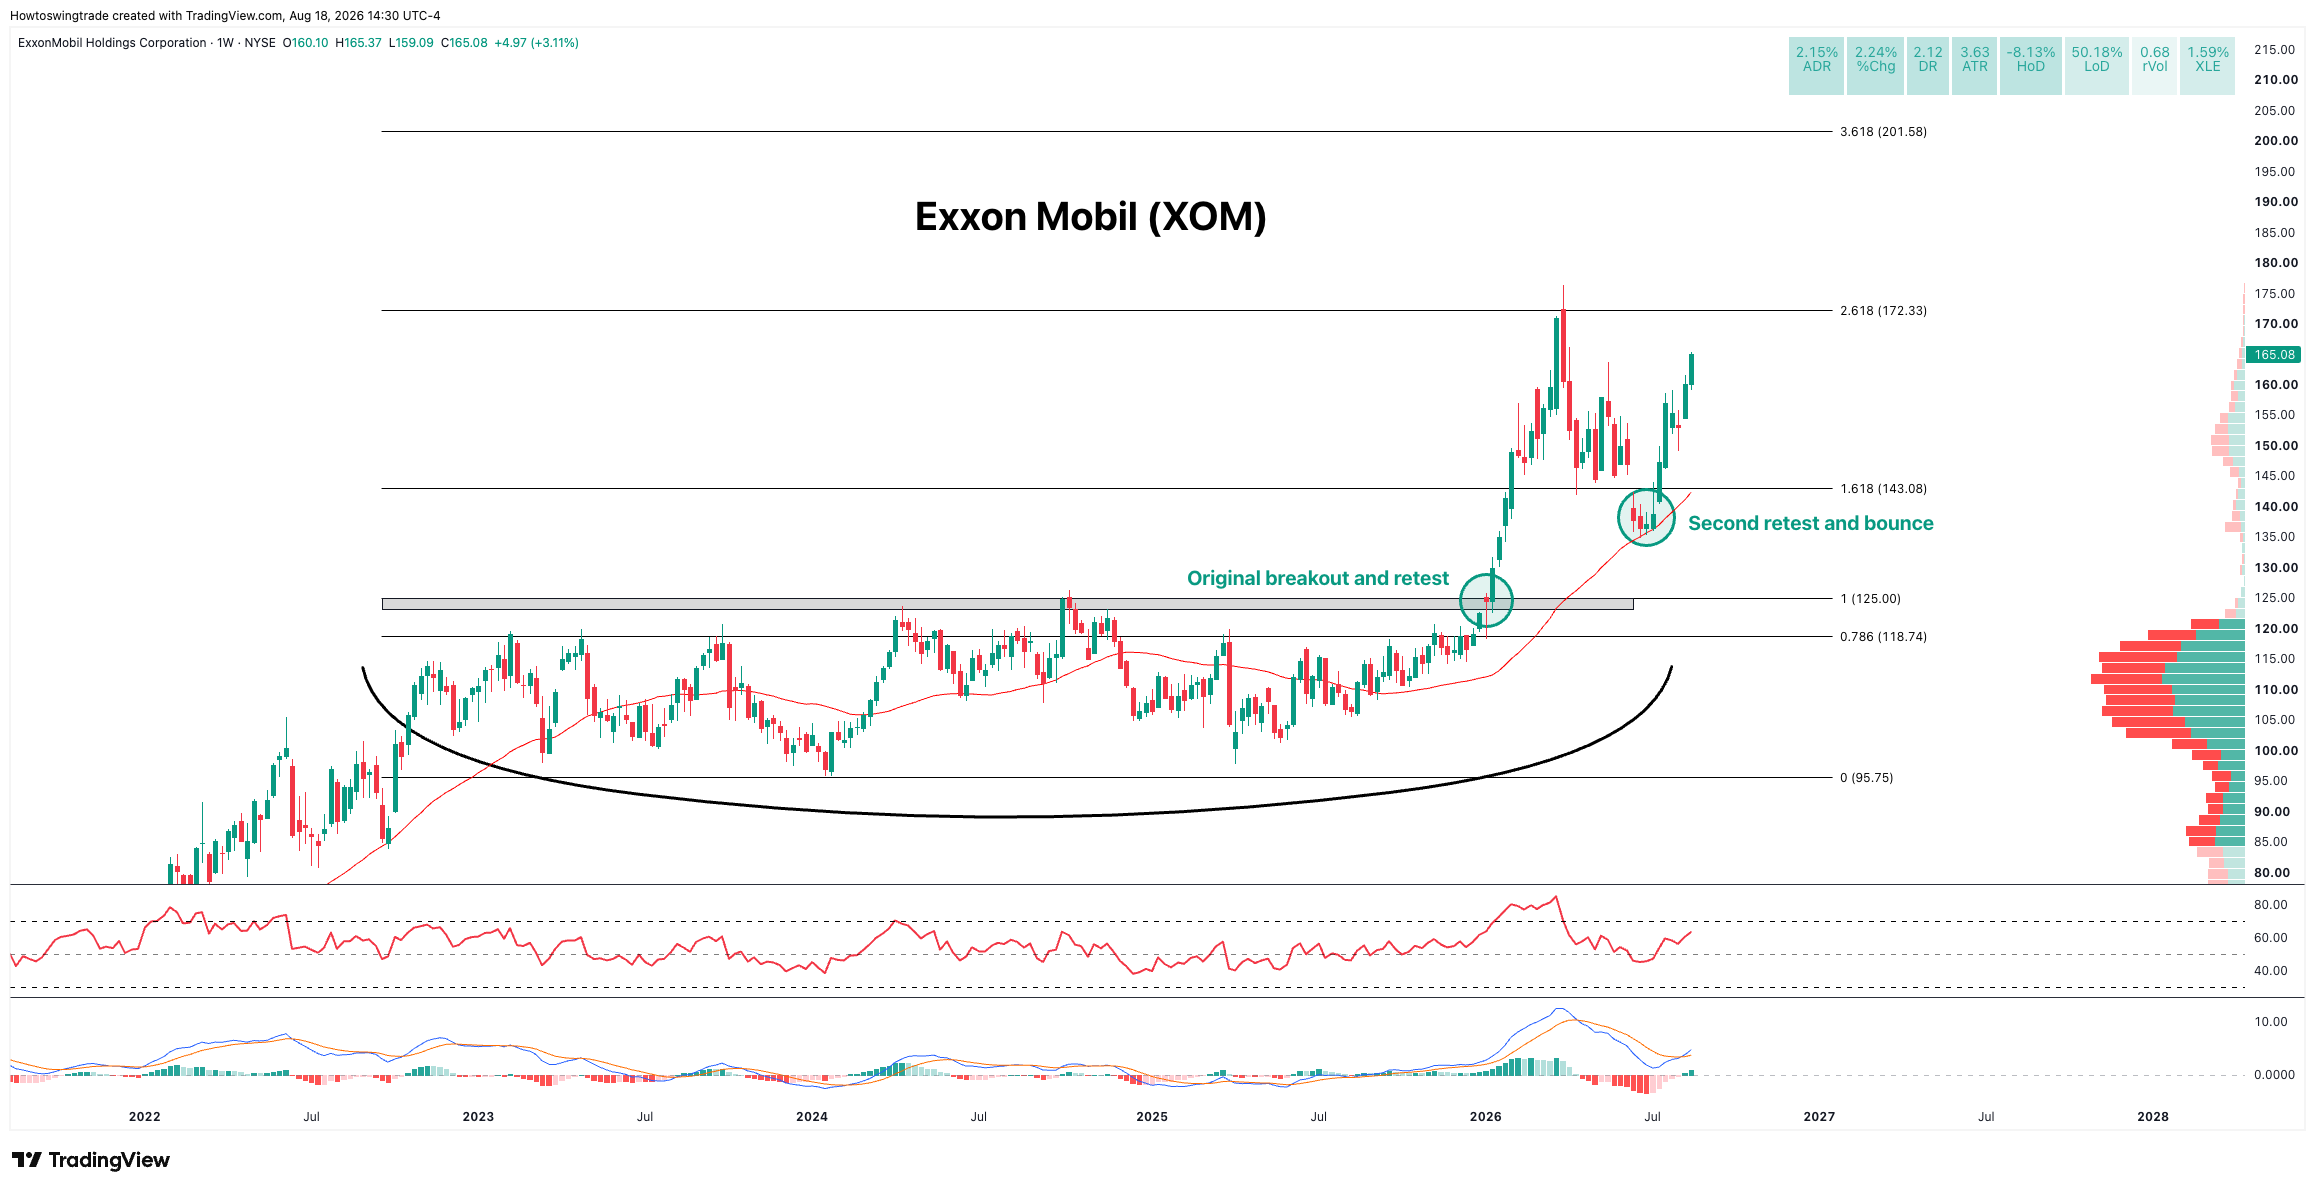
We originally opened a XOM position at the beginning of the year after XOM broke out into new all-time highs and then pulled back in to retest it mid-week.
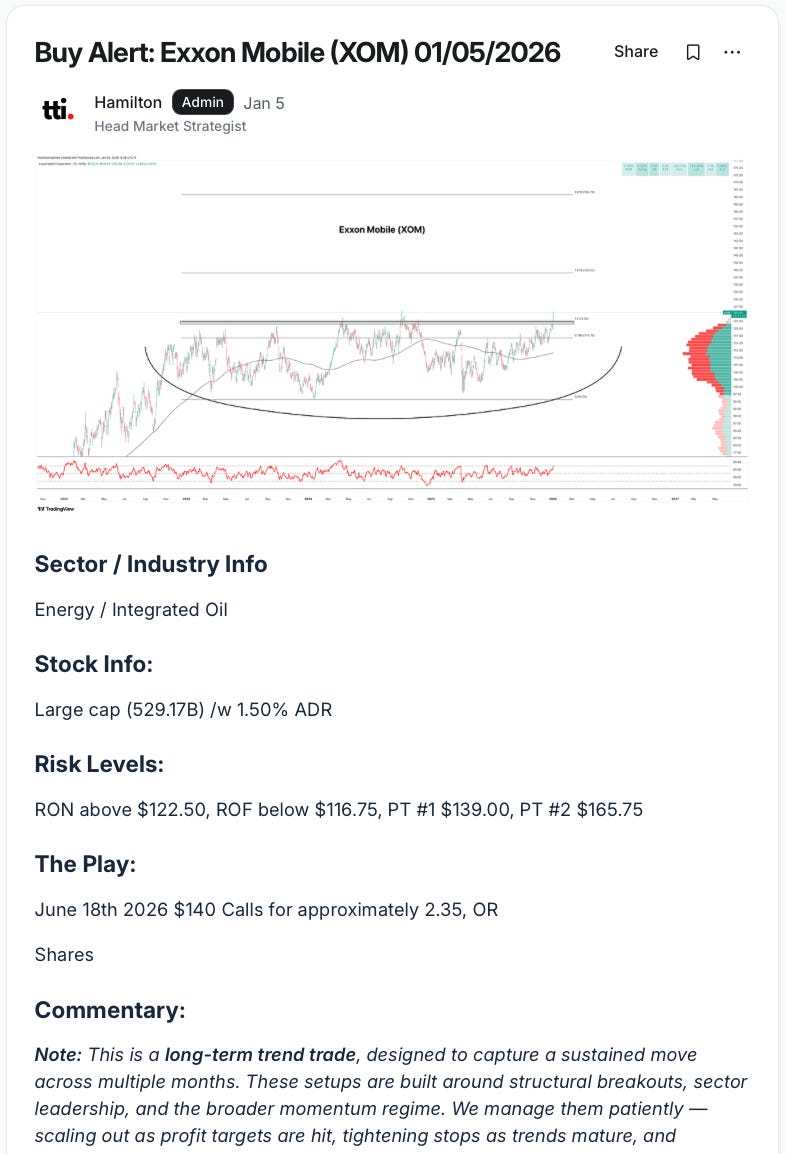
That position ended up making us over 1,000% on the original contracts and around 35% in shares:

After consolidating for a few months (while the AI trade got hot).. energy caught a bid again, institutions rotated in, and our guys started grabbing positions again. XOM remained attractive as it retested and bounced for a second time.
Here’s the XOM position Arvin, a three-year TTI member at the time, shared around the original publication date:
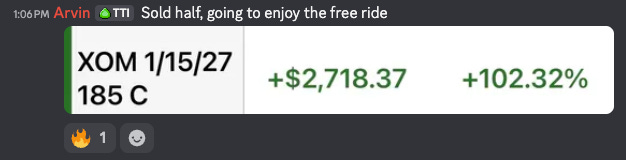
The BRB entry is not perfect. Sometimes the retests end up not bouncing and indeed the trend is over and we lose. But that’s where the next section will come into play.
I also trade other setups.. including event-driven changes of direction, faster momentum setups, etc.
But the principle doesn’t change.
I don’t enter a trade because it’s what everyone else is doing on FinTwit.
I enter because price has done something very specific.
And over 17 years of watching setups fail, I know exactly what I want.
My Goal is to Win Big and Lose Small
Before I buy anything, I ask myself a series of questions that I want you to steal..
Where is my entry or trigger?
What does price need to hit (or not hit) to invalidate my idea?
Where is my first take profit price? My second? My third?
How much am I willing to lose if I am wrong (which I am.. often)?
Are there any catalysts that could change the plan?
Where I get out of my trade is entirely predicated on where on the chart my idea is lost. And my position sizing (how much I am willing to lose) comes from that point.
If the loss is too large because the distance between my entry and stop out are too far apart, I reduce the size of the trade.. or skip it entirely.
I do not move the stop to make the trade make sense.
And I only target 4:1 setups, or greater.. which allows me to maintain around a 50% win rate while remaining profitable.
It sounds simple but it’s tough. Most traders move stops, size too big, and think they need to win every trade.
You don’t. I’m living proof.. as are the members inside of TTI who have been with us for years.
As Jim Roppel says.. price will hurt you but size will kill you.
I’m Not Afraid of Levering Up
I know.. I just talked about how sizing down actually makes a lot of sense in most instances.
But what I’m talking about here is adding an options overlay to the trade.
Once the setup, trigger, target, stop out, and position risk are all cleared.. I look for an extra play that really makes what I do differently than everyone else:
I look for an options overlay to add convexity to the trade.
Convexity simply means I can risk a defined amount of money (premium) while giving myself the opportunity at 10:1, 20:1.. 100:1 returns. Skies the limit.
And a some of them end up being so.. at least the best ones.
Here’s an Intel (INTC) trade we took in early April 2026:


There’s simply no way to make those types of returns without using an options sleeve to hit it.
That doesn’t make options necessarily better than shares.. and I may as well point out that up until like 2021 I had never really traded them as a discretionary trading vehicle.
But options offer a bigger bang for your buck.. especially because that buck can be clearly defined at entry.
The max risk I am willing to take is the premium that I pay to get into the trade.
What makes my method of adding options into the mix different than everyone else is that I sell doubles every single time.
And I don’t mean sell doubles to close the trade.. I mean I sell half of the open position after it hits 100% in profits to get all of my original capital back.
The other half can continue to pay me out for as long as the trend continues to move in my favor.
Adding this layer of convexity has allowed me to participate in some of the biggest wins of my career. And this decade has had no shortage of opportunities for massive wins.
TLDR..
I read the whole market using my top-down approach. I look at regime, breadth, types of leadership, etc.
I look where capital if flowing. I compare asset classes, sectors, industries and more using relative strength across multiple timeframes.
I narrow it down into a smaller leadership group. I use trend, relative strength, and momentum to key in on the best trading opportunities within the strongest areas of the market.
I don’t try to reinvent the wheel with technical analysis. The further you get away from the basics.. things like support and resistance, horizontal level breakouts, while defining your entry, stop, and take profits.. the more margin for error.
I size for a loss. I focus on how much I can lose.. not how much I can win. Maintaining small losses allows your winners to compound over time.
I look to lever up when it makes sense. I’ll add an options overlay when timing, liquidity and payoff exponentially improve the trade.. offering a sleeve of convexity to trades that can pay out huge in the end.
The “It” Factor
Here’s one of my favorite Richard Dennis quotes..
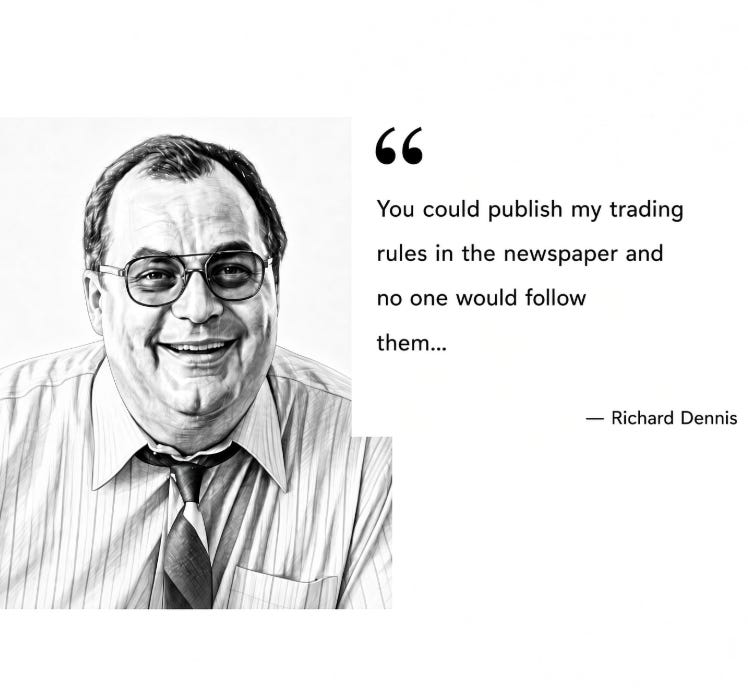
That’s because Dennis knew something that most people will never understand..
While he had proved that he could teach people how to successfully trade and make money in the market, he knew that understanding the system and being confident enough to execute the system were entirely different things.
Confidence, according to Dennis, came from discipline.
Losing. Learning. Studying. And ultimately winning.
Dennis said that his most profitable Turtle’s understood how often the system lost, how long losing periods could last, how much profit might disappear while in a drawdown, and how small changes could alter the end result.
He knew that they needed to know what pain felt like.
And that lesson has stuck with me over the last decade.
A profitable outcome does not prove that the original decision was good.. just like a losing outcome does not automatically prove that it was bad.
The question is whether the decision followed the rules of the system.
Confidence is not believing every trade will work.. but knowing that the system can survive several losing trades/weeks/months and still survive. Then it’s get rich time.
Putting the Process to Work
I’ve been trading the markets for almost half of my life.
There have been some incredible highs as well as earth-shattering lows. And even after all this time, the market can still humble me.
That’s why I keep coming back to the process.
Understanding it is the beginning. Then the market opens, your stock pulls back, another name starts running, and you have to make a decision.
Do you add? Do you wait? Has the idea failed? Are you taking the trade because it fits your process, or because you’re tired of watching everyone else make money?
Those are the decisions we work through inside The Trading Initiative.
I built TTI around the way I actually approach the market. Members get the research, The TTI Trade Desk, and the opportunity to work through the reasoning with us.
Every night I send out a Desk Note explaining what mattered that day, what changed, and what I’m watching next. Inside the Trade Desk, you can connect that market context to individual stock candidates, trade plans, and shared entries, adjustments and exits.
You can study why a name deserves attention, what needs to happen before an entry, and how the trade is managed afterward. Sometimes the useful decision is to keep waiting.
You also get private Discord access with live trading every weekday, plus three coaching sessions in a standard trading week. Bring your questions. Study the replays. Use the education to revisit the parts you haven’t made your own yet.
The goal is to help you develop the judgment to make these decisions yourself.
You still decide what belongs in your account, how much to risk, and when to act. Over time, I want you to understand the reasoning well enough to make the process your own.
If the way I’ve walked through markets in this article makes sense to you, this is what we work on together inside TTI.
Knocking it out of the park with these! Nice read.
Very straightforward Methodology. Bet on the Best of the Best. Thank you