


A Quick Note From Hamilton
Tonight’s post is a little different..
Randy Dunham is an analyst here at The Trading Initiative. He spends his time studying market cycles, relative strength and where leadership is showing signs of change.
This is his first guest post for Profits Over Prophets.
I asked Randy to take over today because basic materials are doing something worth paying attention to:.. they’re making new all-time highs just as the manufacturing cycle appears to be accelerating.
I’ll let Randy take it from here.
- Hamilton
Basic materials are making new all-time highs. That usually creates one of two reactions.
Traders either chase the breakout.. or assume they’ve already missed it.
But what if this breakout is arriving near the beginning of the cycle and not the end?
That’s the question I want to explore today.
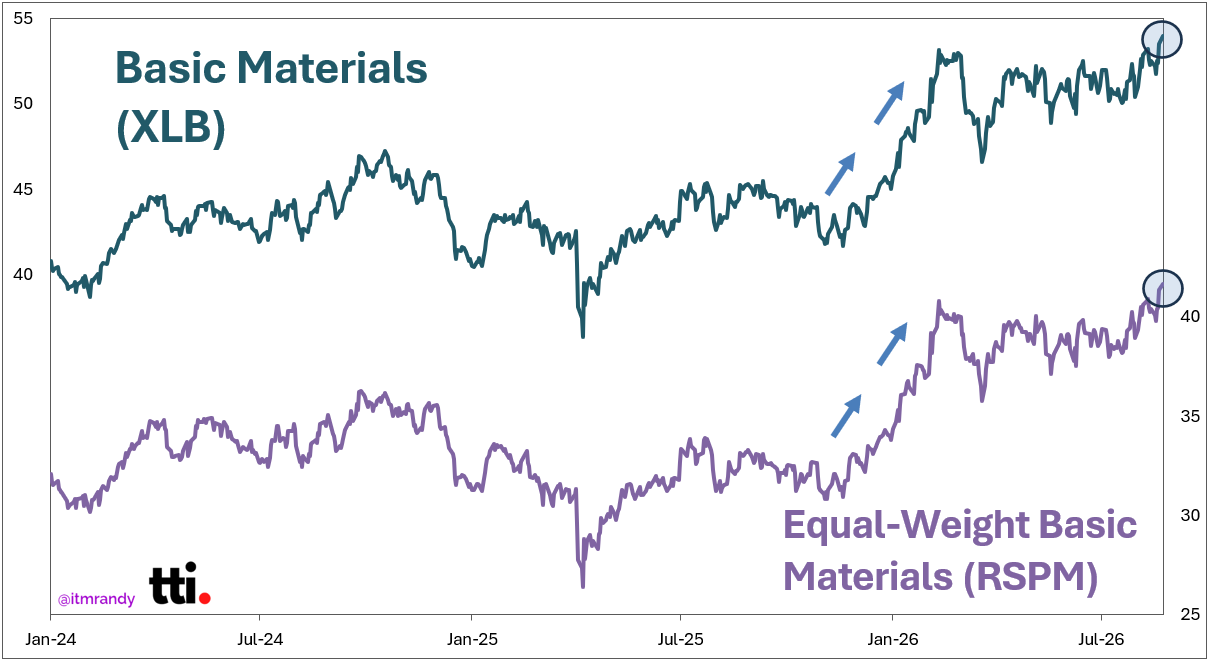
Basic materials (both on an equal- and cap-weighted basis) have recently made new all-time highs. This comes after the multi-year breakout materials made in Q1 2026.
Why it matters: A sector at all-time highs is a vote of confidence in its future outlook. And all-time highs are often accompanied by more all-time highs.
But it isn’t just the technical chart that looks good. There’s a larger force at play.
The big picture: Basic materials are benefitting from a recovery in the manufacturing cycle.
The ISM Manufacturing PMI is a monthly indicator that measures the health of the U.S. manufacturing sector. It’s the go-to read on U.S. manufacturing and the broader business cycle.
Basic materials are highly influenced by that cycle because they sit at the very beginning of the supply chain, as the raw inputs for finished goods. When the cycle picks up, factories make more products and buy more raw materials.
That flows straight to the bottom line of basic materials companies.
How you read ISM Manufacturing data:
Above 50, manufacturing sector growing compared to last month
Below 50, manufacturing sector shrinking compared to last month.
The chart below highlights basic materials performance during ISM manufacturing peaks (red line) and troughs (green line):
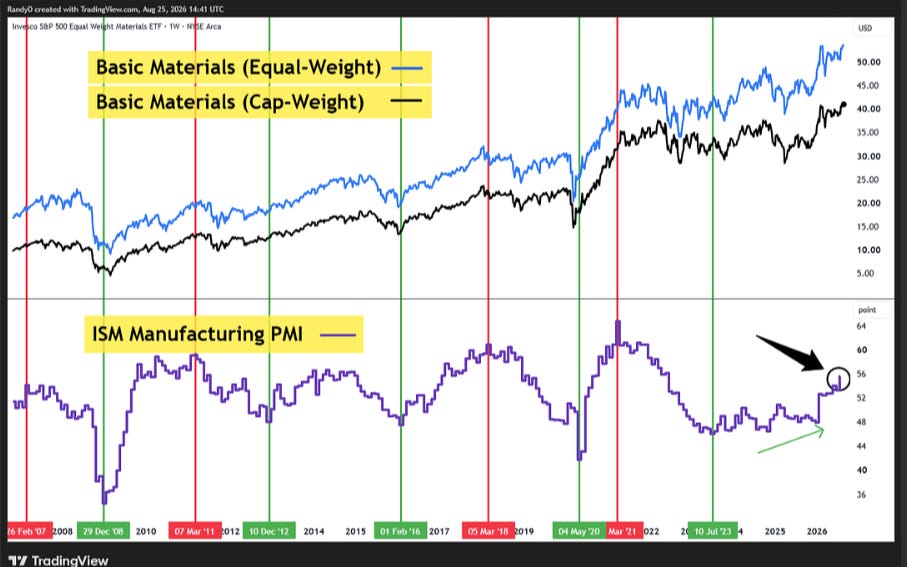
The manufacturing cycle officially bottomed in July 2023, but the typical “V” shaped recovery never followed. Manufacturing improved slowly over the next few years instead.
Here’s the exciting part: July’s ISM print came in at 55.6. That’s the highest reading in over four years, and it solidifies that the manufacturing cycle is actually turning.
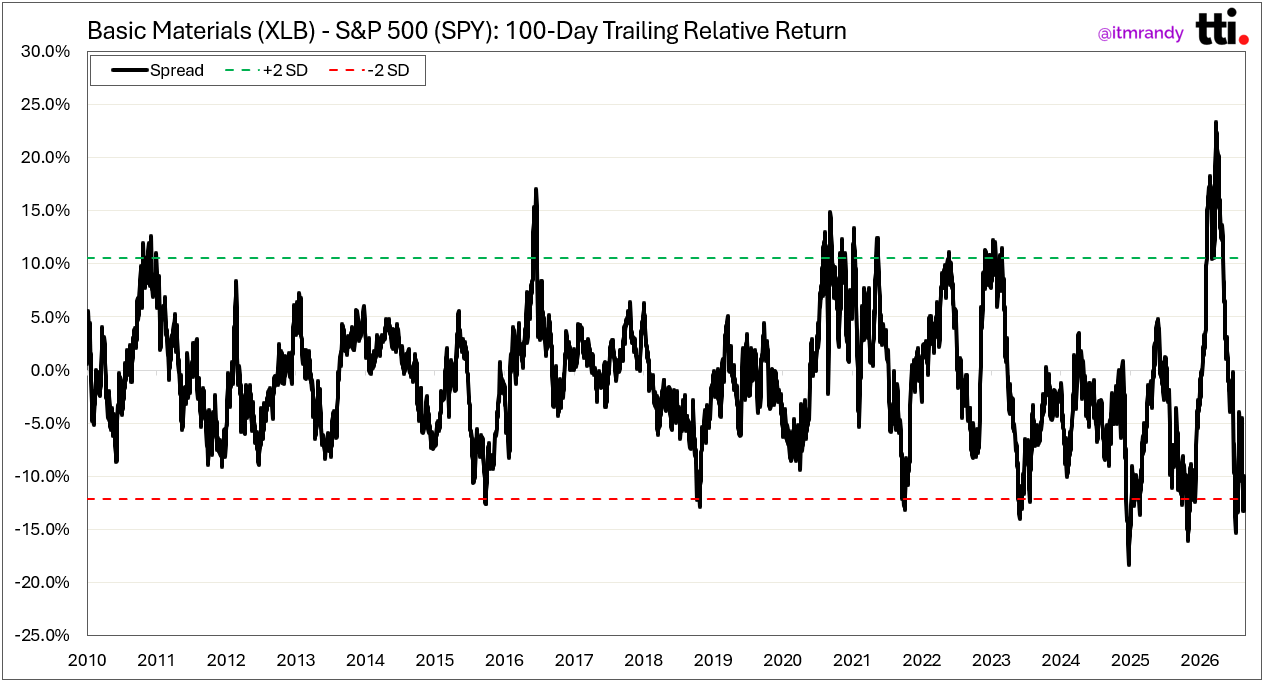
What’s most interesting is that relative return spreads are at depressed levels.
Here’s the 100-day trailing relative return spread between basic materials and the S&P 500:
The equal-weighted version tells the same story, and I think it’s the more accurate read since it isn’t distorted by large names:
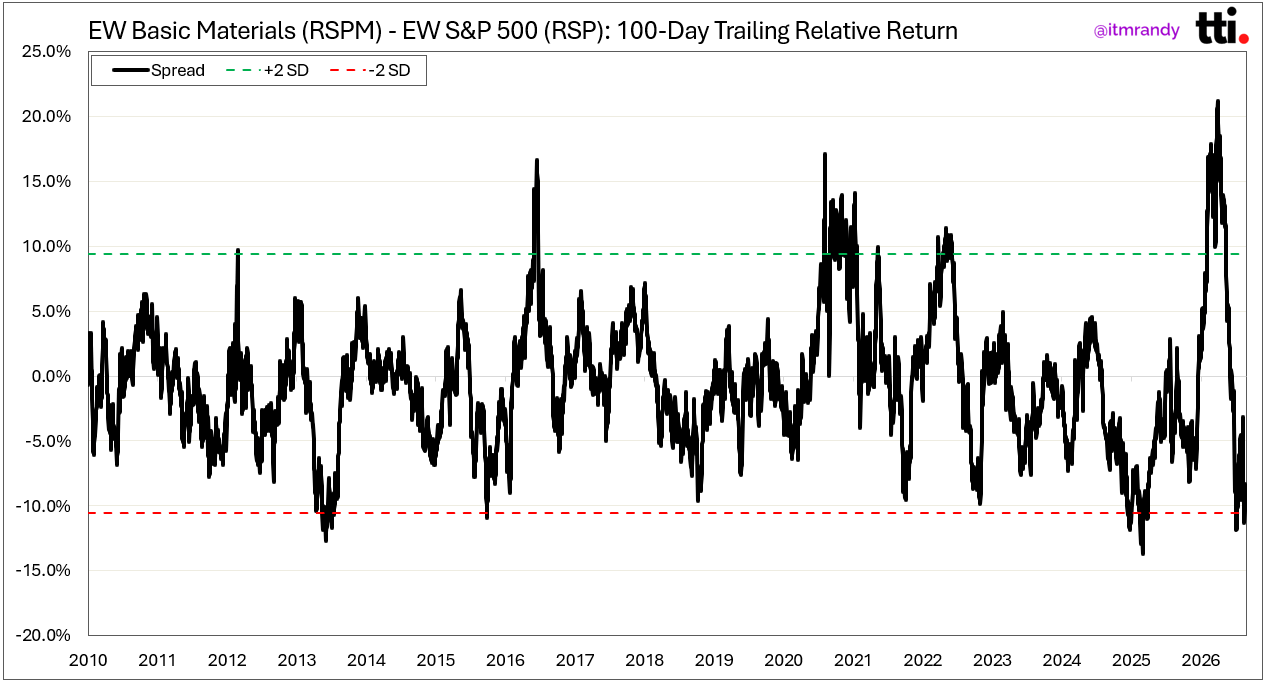
So even though basic materials are breaking out to all-time highs, the sector isn’t stretched relative to the S&P 500.
My read: Basic materials have a bigger story going on that gives a massive tailwind to the sector. Not only is the sector breaking out to all-time highs, but it’s accompanied by a pickup in the manufacturing cycle. All the while, the sector still hasn’t become extended relative to the S&P 500.
That combination is what potentially gives this breakout runway, but some industries within basic materials look better than others.
Using Finviz’s industry classification, I’ve organized the industries by YTD performance and by the number of constituents above their 50-day SMA as a breadth gauge:
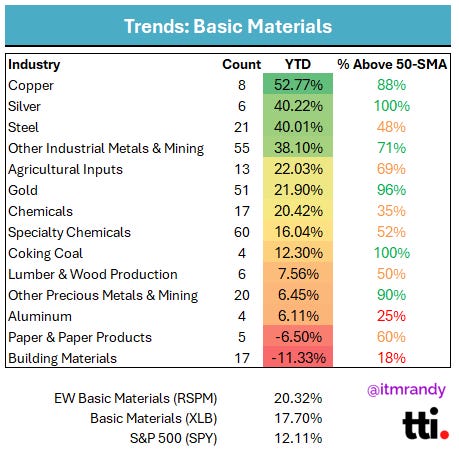
Metals, specialty chemicals and agricultural inputs look the most interesting to me.
That doesn’t make every stock in those groups a trade but it does tell us where to begin looking.
The sector trend gives us the direction. The manufacturing cycle gives us the larger tailwind. And industry strength helps us narrow the search to the areas attracting the most participation.
The individual chart still has to give us the entry and the risk still has to make sense.
One last thought: New highs don’t tell us that a move is over.. they tell us buyers are willing to pay prices nobody has paid before.
When that happens as the underlying cycle improves and before relative performance becomes extended.. the breakout deserves our attention.
Randy Dunham
Analyst, The Trading Initiative
P.S. Which materials group should I break down next: metals, specialty chemicals, or agricultural inputs?
If you enjoy thinking about markets this way, this is the same evidence first process we use every day inside The Trading Initiative.
You can follow Randy on X at @itmrandy and read more of his work at Trade by Trade.
Educational content only. Not investment advice or a recommendation to buy or sell any security. Nothing here accounts for your individual situation or risk tolerance. All trading involves risk, including possible loss of principal. Past performance doesn’t guarantee future results.