


I have to preface this quick article with the fact that I attack the market from two angles: top-down and bottom-up.
My top-down process is called the Market Blueprint framework.. and it focuses on building the bigger picture first.
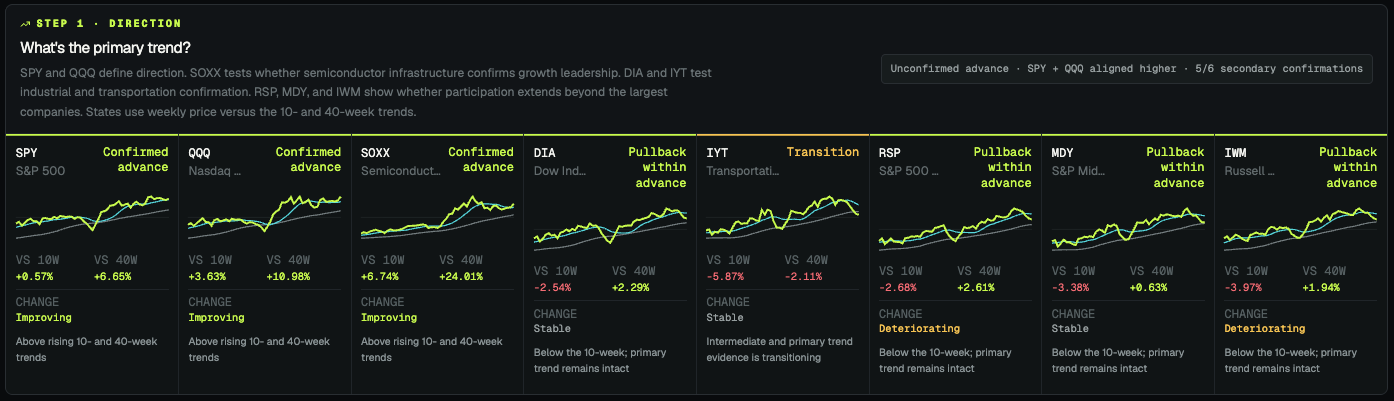
Which direction are the major indexes trading?
How is market breadth holding up?
Which sectors, industries, narratives and themes are leading?
How are financial conditions: restrictive or accomodative?
Are the largest financial institutions buying, selling, or waiting?
It seems complicated. And maybe it is. But after doing it for so long.. it’s like shooting your 10,000th free throw. It’s just automatic.
Here’s what step 1 (of 7) looked like tonight:
Only once I know what I am trying to do in the market.. buy, sell, wait, etc so I move onto finding the right trading vehicle.. the right stock.. to express that view.
And that’s what this article is going to focus on: my bottom-up process which I call my Hit List framework.
Three things matter to me more than anything when it comes to the actual stock I am trading:
It has to be trading in the direction of the primary trend.
It has to be showing relative strength against the market, its sector and industry, and a basket of its peers.
It has to be accelerating rapidly.
Let’s get into each.
The trend is the most important part of any trade.
I don’t care if you trade with it or trade against it — you need to know which way price prefers to be moving.
For me.. I’ve been trading for 17 years. I have traded every style you can imagine. And nothing comes close in terms of profitability than simply trading alongside the direction of the trend.
So that’s where I start. If the Market Blueprint framework told me that I need to be buying because the market is in a primary uptrend and has supportive evidence that higher prices are coming.. I look for stocks that are trending higher.
Here’s how I do it.
Price must be..
Above an upwards sloping 20-day moving average.
Above an upwards sloping 50-day moving average.
Above an upwards sloping 200-day moving average.
Mind blowing stuff, right?
I’m looking for all three moving averages, which represent the short, intermediate and long-term trend of the stock, underneath the price of the stock and sloped upwards.
The slope part is important. I know you probably thought you wouldn’t ever have to use slope again after 8th grade but here it is showing up.. and it’s absolutely paramount to your long-term success.
Upwards sloping moving averages convey an extra degree of confidence that the trend will continue higher. And vice versa — downward sloping moving averages will be more durable to the downside.
You have to start with trends when buying the strongest stocks in the market.
The second thing that matters to me is relative strength. And I don’t mean the RSI indicator.
I’m talking about the concept that whatever stock you’re looking at is showing leadership qualities.
How can you do that? Simple. Compare the performance of the asset you are looking at trading with the performance of every other asset you could be trading.
Here’s how I do it:
The stock I am looking at must be outperforming the broader market.
The stock I am looking at must be outperforming its sector.
The stock I am looking at must be outperforming its industry.
The stock I am looking at must be outperforming (a majority of) the top 5 stocks within the same basket of stocks.
This is tricky because most stocks will fail this test. And that’s a good thing.
You don’t want a bunch of stocks all showing incredible relative strength. You want THE BEST stock that’s showing relative strength.
“If you want to outperform the market, you need to own the things that are outperforming the market.”
Remember that forever.
The last thing I am looking for is momentum in the stock.
It does me no good to find a stock that is in a primary uptrend, showing leadership qualities, but is slowing down in its advance higher.
Simply put.. you need to find the fastest horse in the race. And then bet the farm on it.
Here’s how I do it:
The stock must be trading in a bullish momentum regime, defined by the RSI.
The stock must be accelerating higher with momentum increasing, defined by the MACD.
Think about it like this..
You don’t want to race the Lamborghini if the tanks on E. Doesn’t matter how cool it looks. It still needs to move and you still need to win the race.
Once you establish all three of those things.. you move onto setting up the actual trade.
Let’s walk through one I’m in right now: RingCentral (RNG).
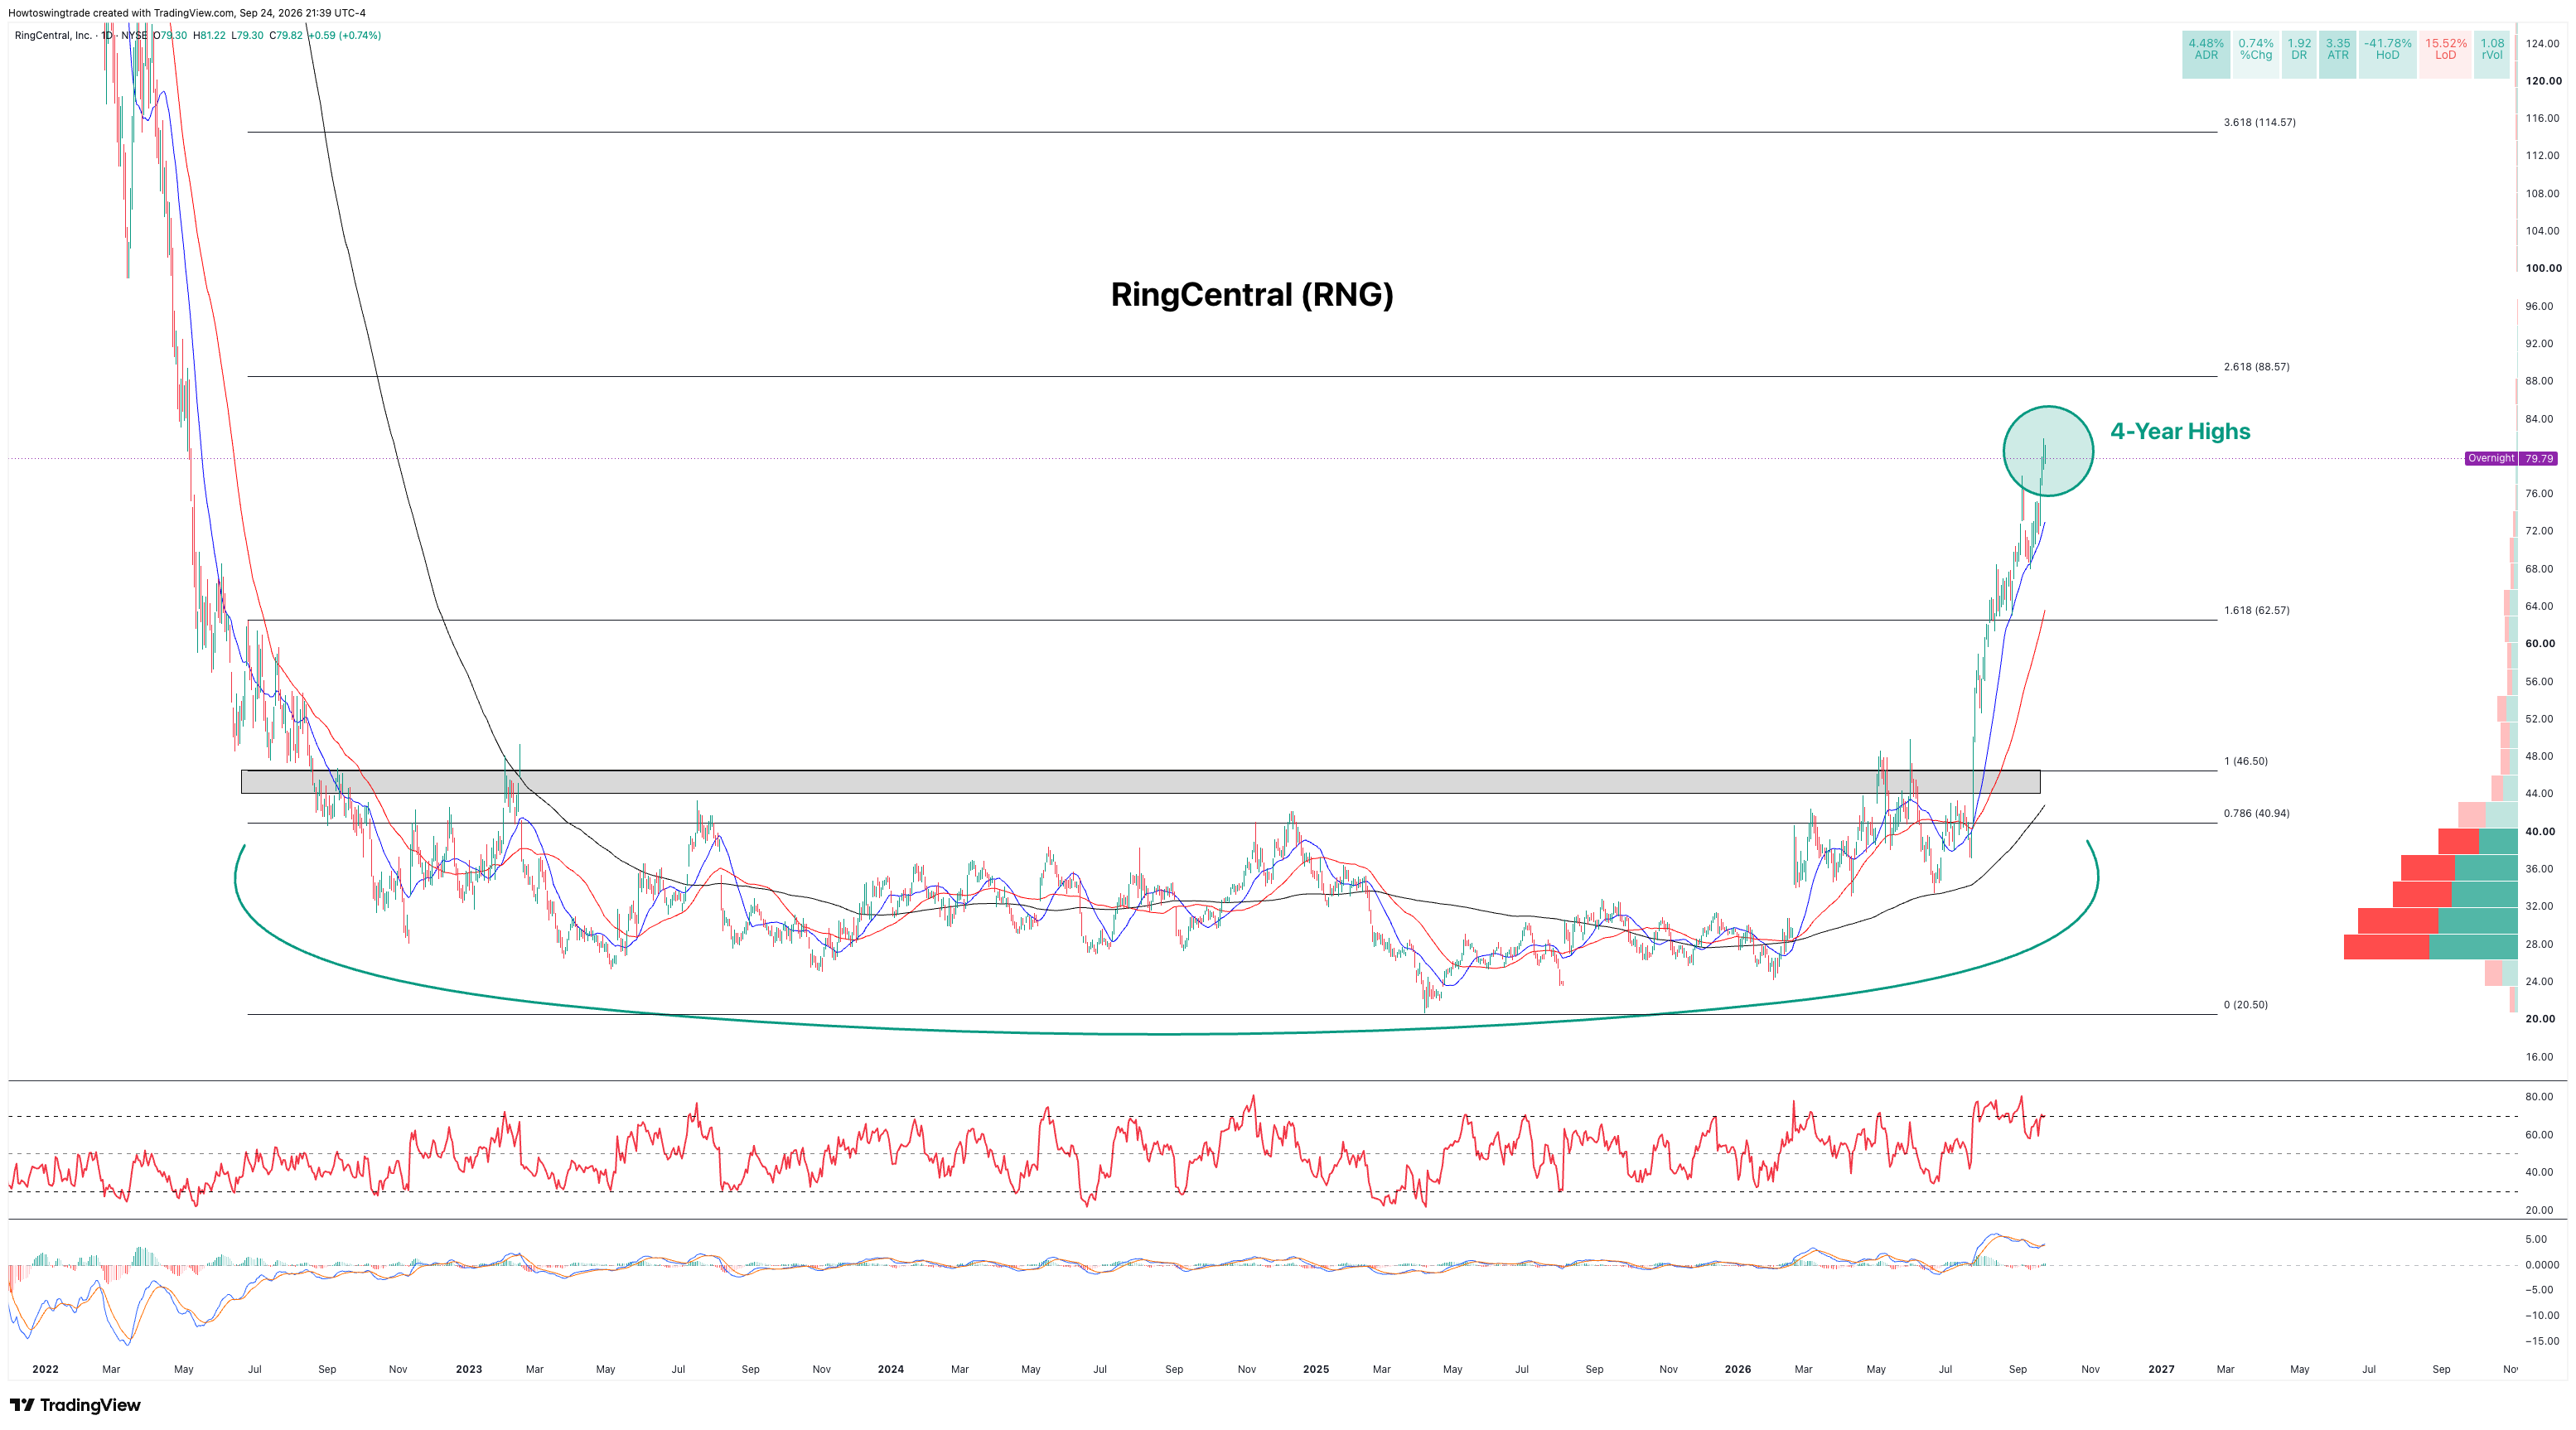
The members inside of TTI bought RNG back in late July as it broke out above the 46.50 area. It’s since moved over 70% in our favor for a big win. Let’s talk through the chart setup.
RNG had traded in a massive range for over 3 years before breaking out. These massive bases are oftentimes referred to as accumulation zones (Wyckoff) or Stage-1 bases (Weinstein).
Regardless of what you call them — once they break out, the extended move is likely higher for a significant amount of time and offer an easily defined entry point.
All three moving averages (20, 50, and 200) were underneath price while sloping upwards. I refer to those as stacked.
RNG had also showed up on our Emerging Leaders scan — a scan inside of our TTI Trade Desk that surfaces stocks beginning to show leadership qualities before the crowd catches on.
Here’s a portion of what our Emerging Leaders scan looks like tonight:
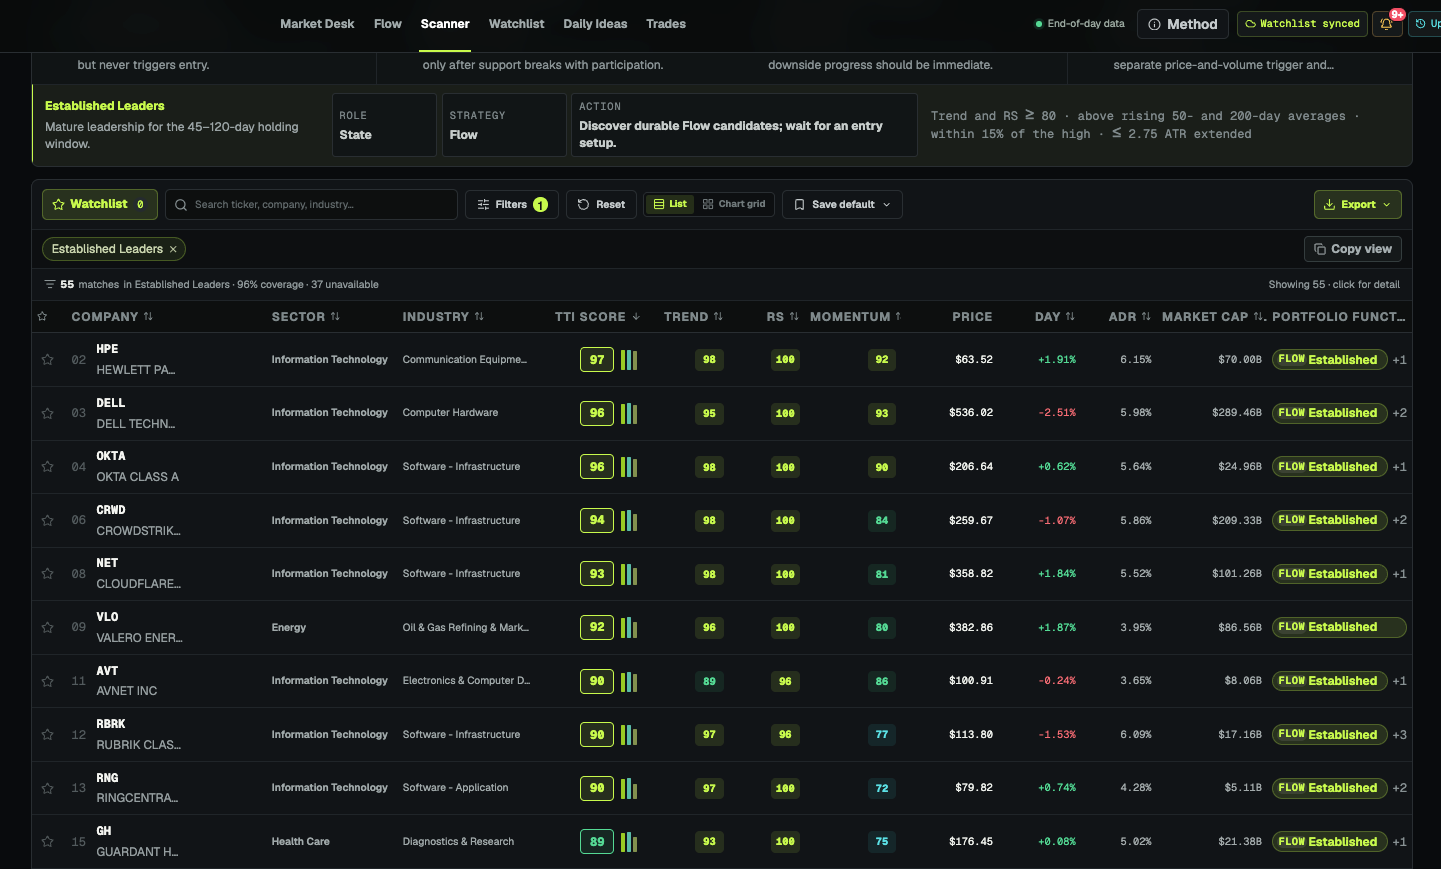
We took a second look at RNG after we scanned through it live during our Execution Report webinar. RNG is a software stock, so we compared it against the tech sector (XLK) and the software industry (IGV).
In both instances, we saw that RNG was leading both higher. That’s the kind of relative strength we want to see when entering a trade.
Lastly.. we checked the momentum factor. Was RNG accelerating into the breakout point? Or was there a strong chance of a failed breakout?
RNG had officially entered a bullish momentum regime when the RSI hit overbought territory back in February.. and has remained within that bullish momentum regime the entire time.
And the MACD was crossing over and signaling that the move in momentum was just starting. We knew that bulls had control of this primary trend higher. And because we knew what we were looking for.. we were able to capitalize on it.
Here’s a tweet I sent out back in late July highlighting the setup:


We’ve since added into the trade at 62.50, sold options contracts worth over 100%, and more. This one trade has paid us out for nearly 2 months now. And there is no signs of it stopping anytime soon.
Here’s a piece of what our stock card says about RNG:
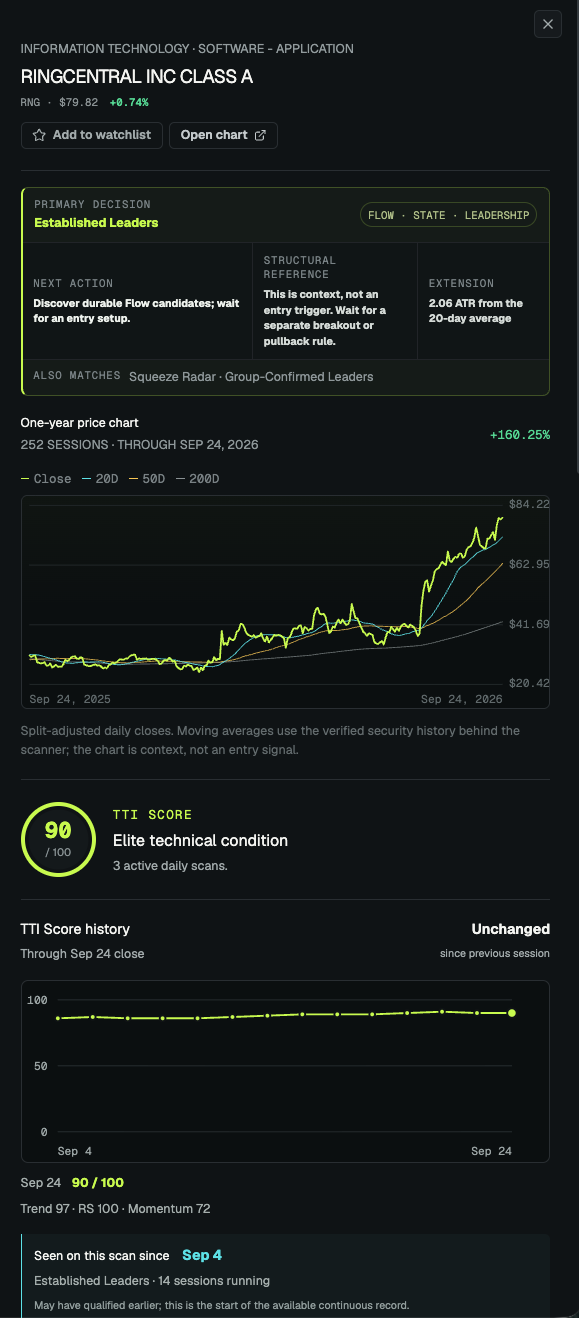
It’s easy to highlight the wins. What’s hard is turning the process that found the trade into a repeatable system that can be replicated over and over and over.. putting yourself in front of the best possible trades at all times.
Not all of them are going to work. And that’s OK. The one’s that do will pay for the ones that don’t 10x over time. The goal is to give yourself the best possible odds to smack those grand slams. And the Hit List framework is there to do just that.
Trading strategies and systems come and go. But trend, relative strength and momentum are core concepts that have stood the test of time. I encourage you to incorporate them into your trading. I guarantee you will have better results.
If you’d like to learn the Hit List framework (and our Market Blueprint framework) live with us, join TTI today. We host 3 webinars per week, host live trading every day, and you’ll have access to our Trade Desk software.. filled with our proprietary scanners, trade ideas, and more.
If you’re serious about learning how to do this.. join our community. You won’t be spoon feed signals. Although it never hurts to make a couple bucks trading what we’re trading while you learn how to do this yourself.
Thanks for taking the time to read. Let me know in the comments what you think about our Hit List framework. As well as anything else you think would be of value for me to write about.